

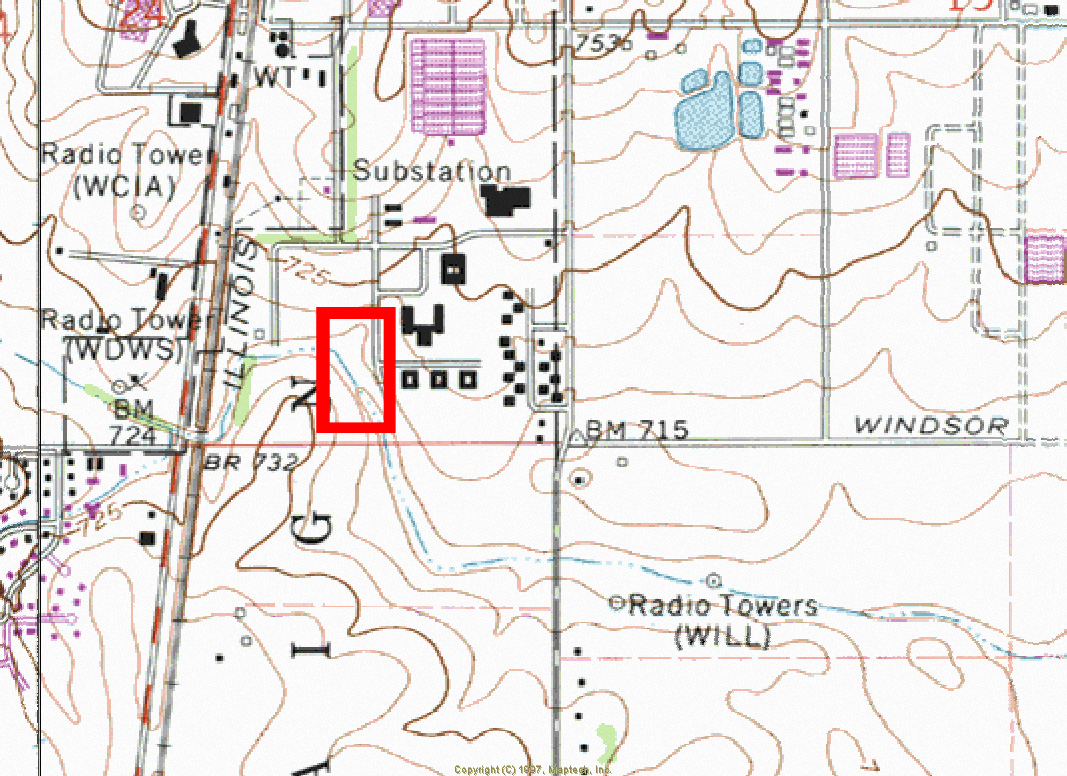
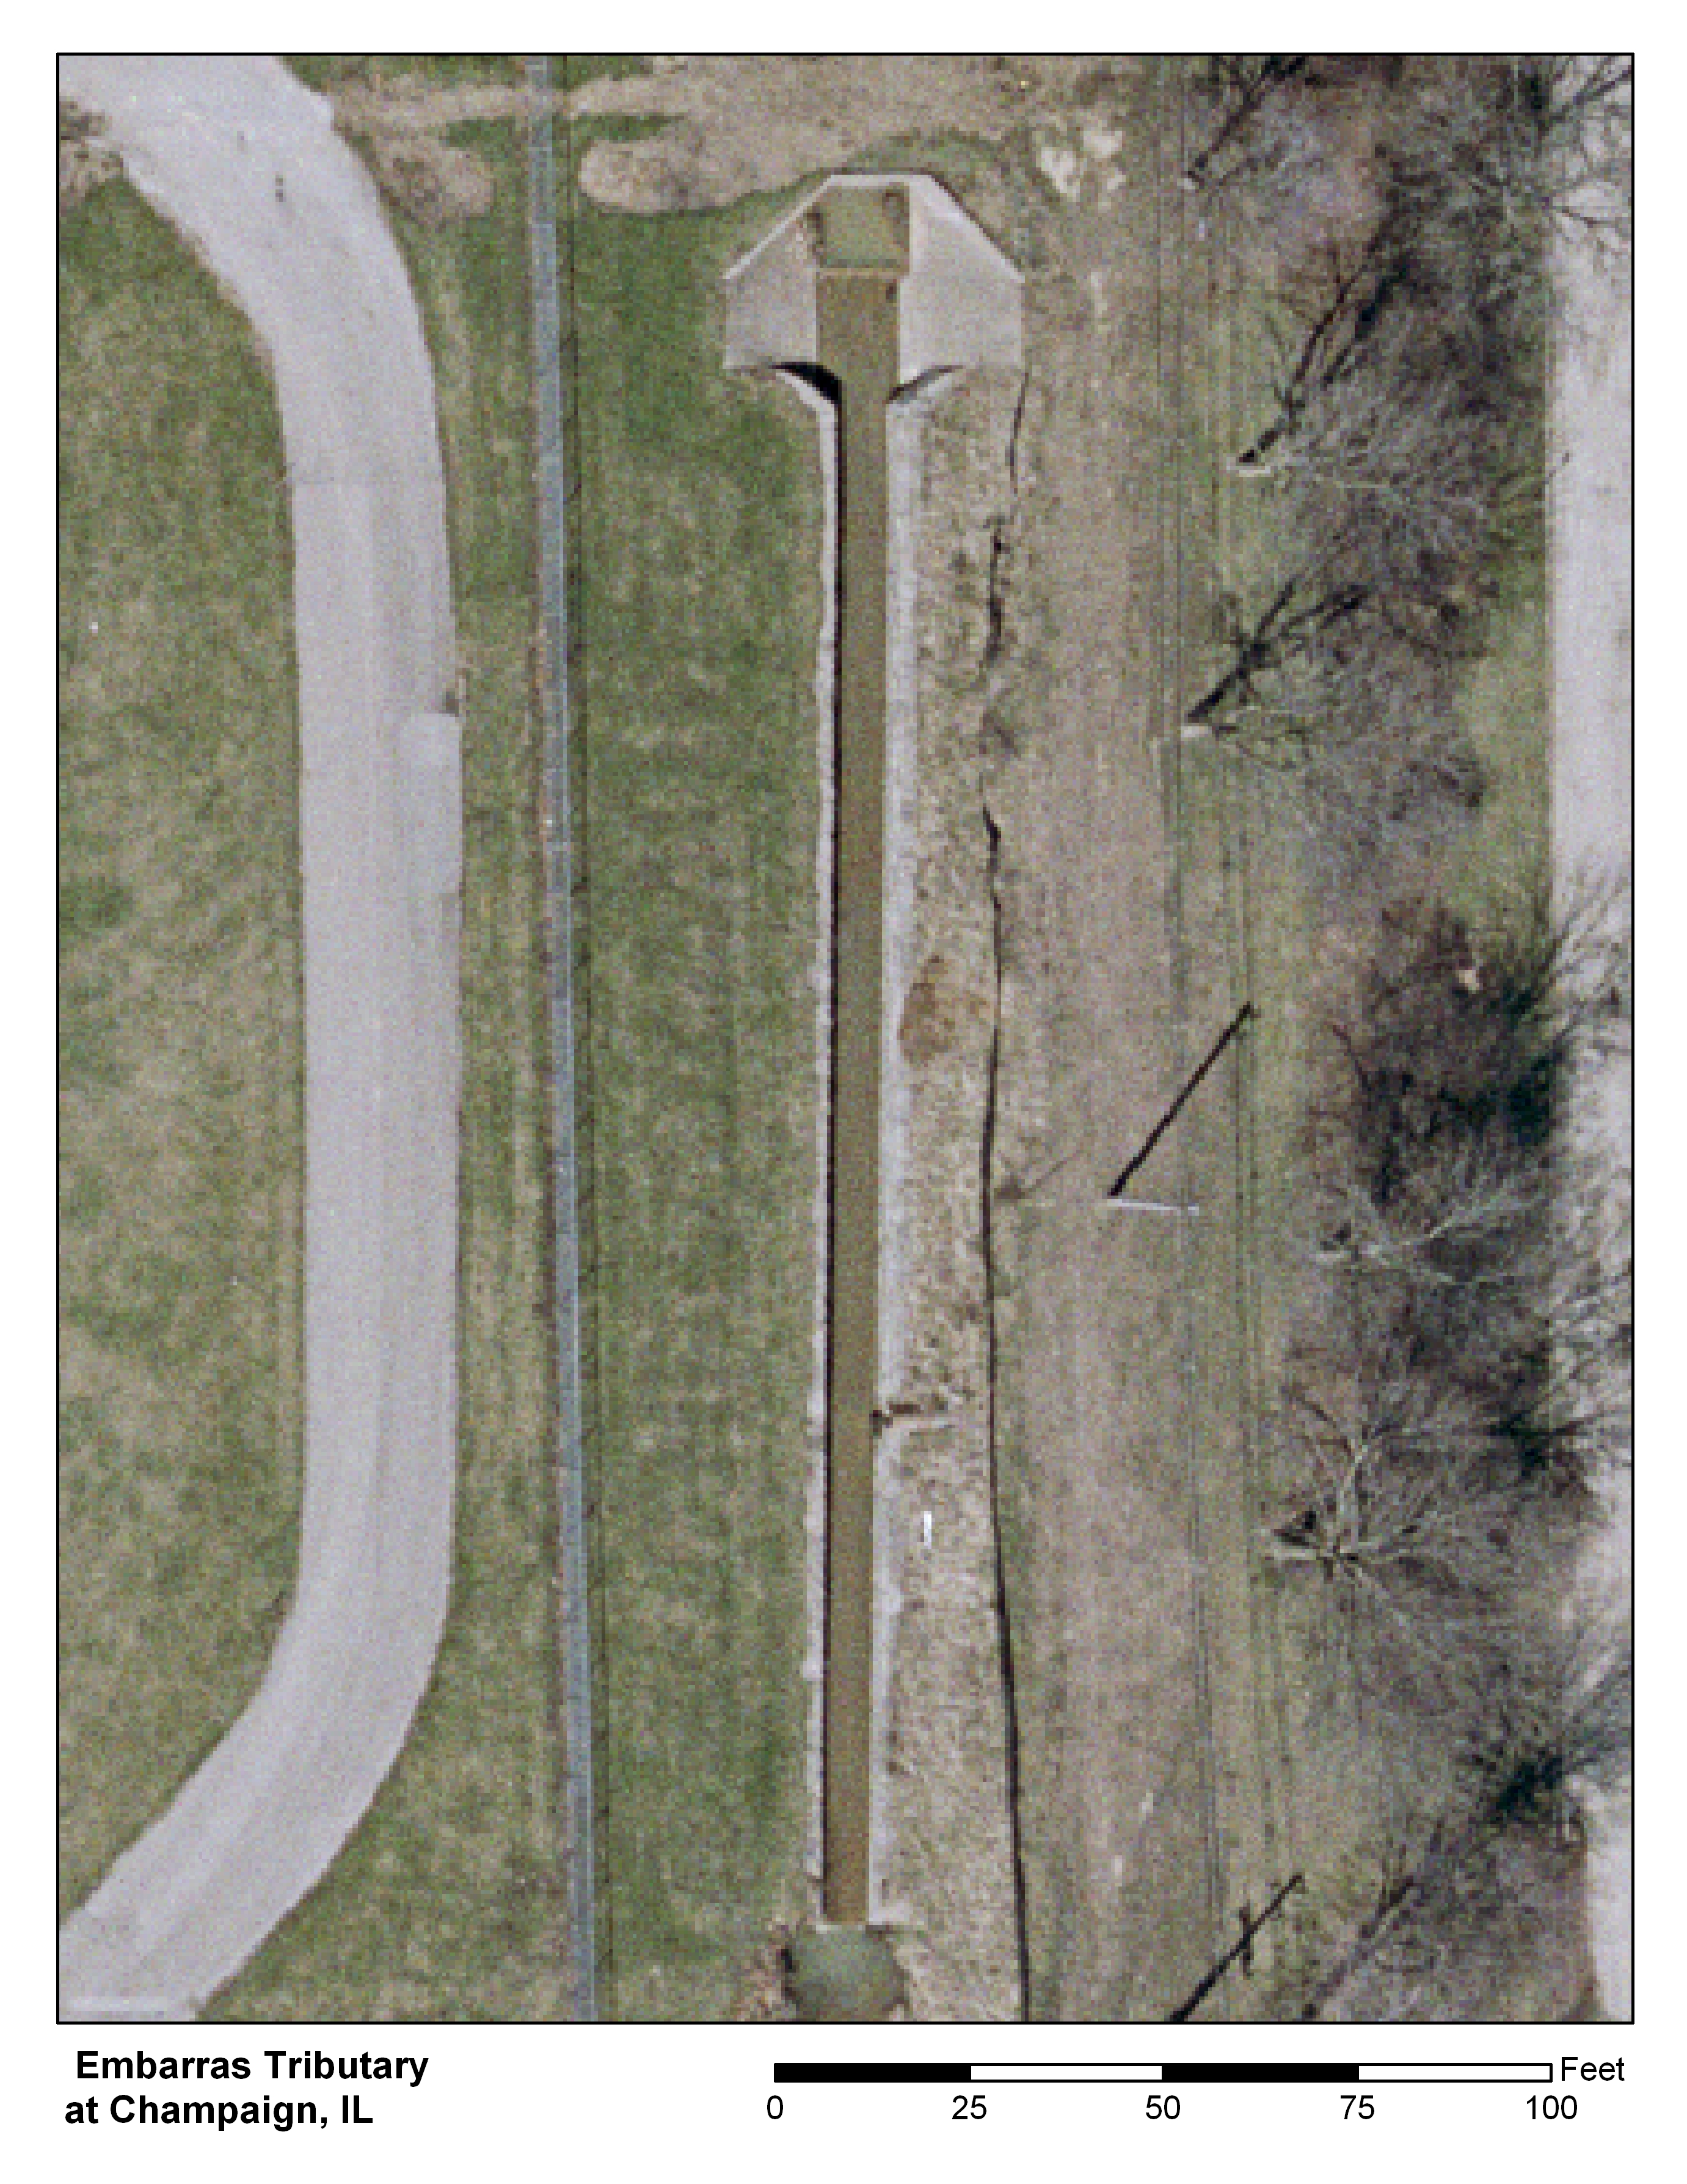
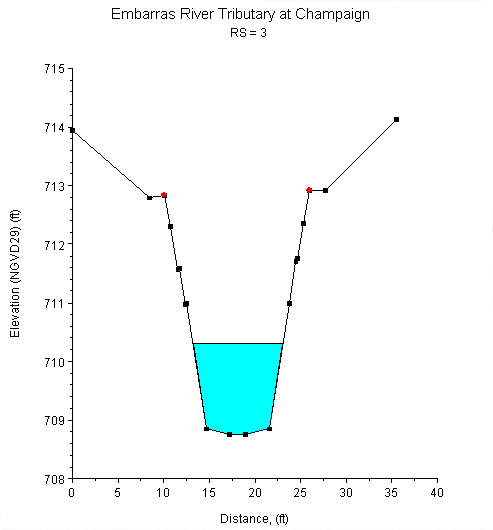
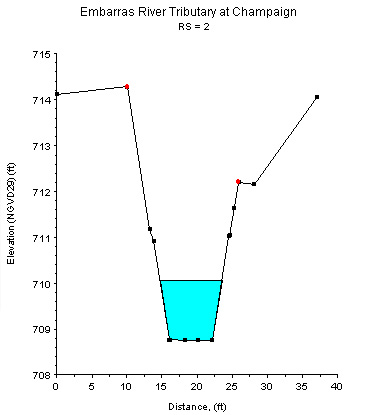
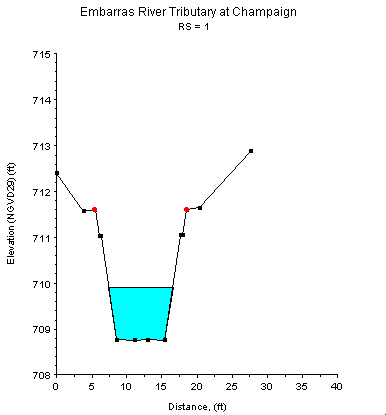
Study Reach.--The channel reach is a rectangular concrete drainage channel in an urban setting, as shown in the quadrangle map on the top left. It enters the Embarrass River at mile 192.8. The study reach, about 200 ft long, is located south of Gerty Street, to the west and parallel to Griffith Drive. Three cross sections (surveyed by USGS, in February 2006) are available for describing the channel geometries considered in the study, and the locations of the cross sections are shown in the aerial photograph on the top right. Because of the similarities in cross sectional geometries, cross sectional plots at river stations (RS) 1, 2, and 3, as plotted above, are selected as representative cross sections.
Gage Location.--Lat 40°05'09"N, long 88°14'36"W (NAD of 1983), in NW1/4 SW1/4 SE1/4 sec.24, T.9N, R.8E, M.3, Champaign County, Hydrologic Unit 05120112, a chiseled square on the top left side of the concrete wing-wall, about 200 ft. south of Gerty St., and south-west of the intersection of Gerty St. and Griffith Drive. The USGS streamgage station number is 03343200.
Drainage Area.--undetermined (due to subsurface tiles)
Gage Datum and Elevations of Reference Points.--No gage is established at this site. A reference point, RM-1, about 200 ft south of Gerty St., is a chiseled square on the top left side of the concrete wing-wall, above the main pipe outfall, elevation = 719.875 ft. RP-N2 is a bolt on the left-inside wall of the concrete channel, located about 10 ft. upstream from the end of the reach, elevation = 710.928 ft. RP-N3 is a bolt on the left-inside wall of the concrete channel, located about 20 ft. downstream from the beginning of the channel, elevation = 710.901 ft. All elevations are referenced to NGVD29.
Stage, Discharge Measurements and Computed n-Values.--Water levels are read with an engineer's ruler at both bolts. Flows are measured by wading in the concrete channel, downstream of RP-N2 near the end of the channel. When possible, multiple discharge measurements were made during a rise and recession to provide data for calculating n-values over a range in stage. The computed n-values are listed in the following table. Whenever possible, the computed n-values are associated with a photograph taken at the time of the measurement. The photographs are arranged from low to high discharge in order to illustrate the contributing factors of n-values at a particular discharge.
| Date of Observation | Discharge (ft3/s) | Average Cross Section Area (ft2) | Hydraulic Radius (ft) | Mean Velocity (ft/s) | Slope (ft/ft) | Coefficient of Roughness n |
|---|---|---|---|---|---|---|
| 3/8/2006 | 3.5 | 2.7 | 0.35 | 1.39 | 0.001316 | 0.019 |
| 3/8/2006 | 3.8 | 2.9 | 0.37 | 1.38 | 0.001422 | 0.021 |
| 3/8/2006 | 5.0 | 3.1 | 0.40 | 1.69 | 0.001525 | 0.018 |
| 7/20/2006 | 8.2 | 3.8 | 0.47 | 2.23 | 0.001417 | 0.014 |
| 7/20/2006 | 8.2 | 3.8 | 0.47 | 2.23 | 0.001417 | 0.014 |
| 7/20/2006 | 11.7 | 4.8 | 0.57 | 2.53 | 0.001863 | 0.015 |
| 4/6/2006 | 37.7 | 10.8 | 1.04 | 3.56 | 0.002698 | 0.019 |
| 4/6/2006 | 41.1 | 11.3 | 1.07 | 3.69 | 0.002512 | 0.018 |
| 4/6/2006 | 43.4 | 11.8 | 1.10 | 3.75 | 0.002698 | 0.018 |
| 4/6/2006 | 45.3 | 12.1 | 1.12 | 3.81 | 0.002389 | 0.018 |
| 4/6/2006 | 45.3 | 12.3 | 1.13 | 3.74 | 0.002420 | 0.018 |
| 4/6/2006 | 45.4 | 12.3 | 1.13 | 3.75 | 0.002409 | 0.018 |
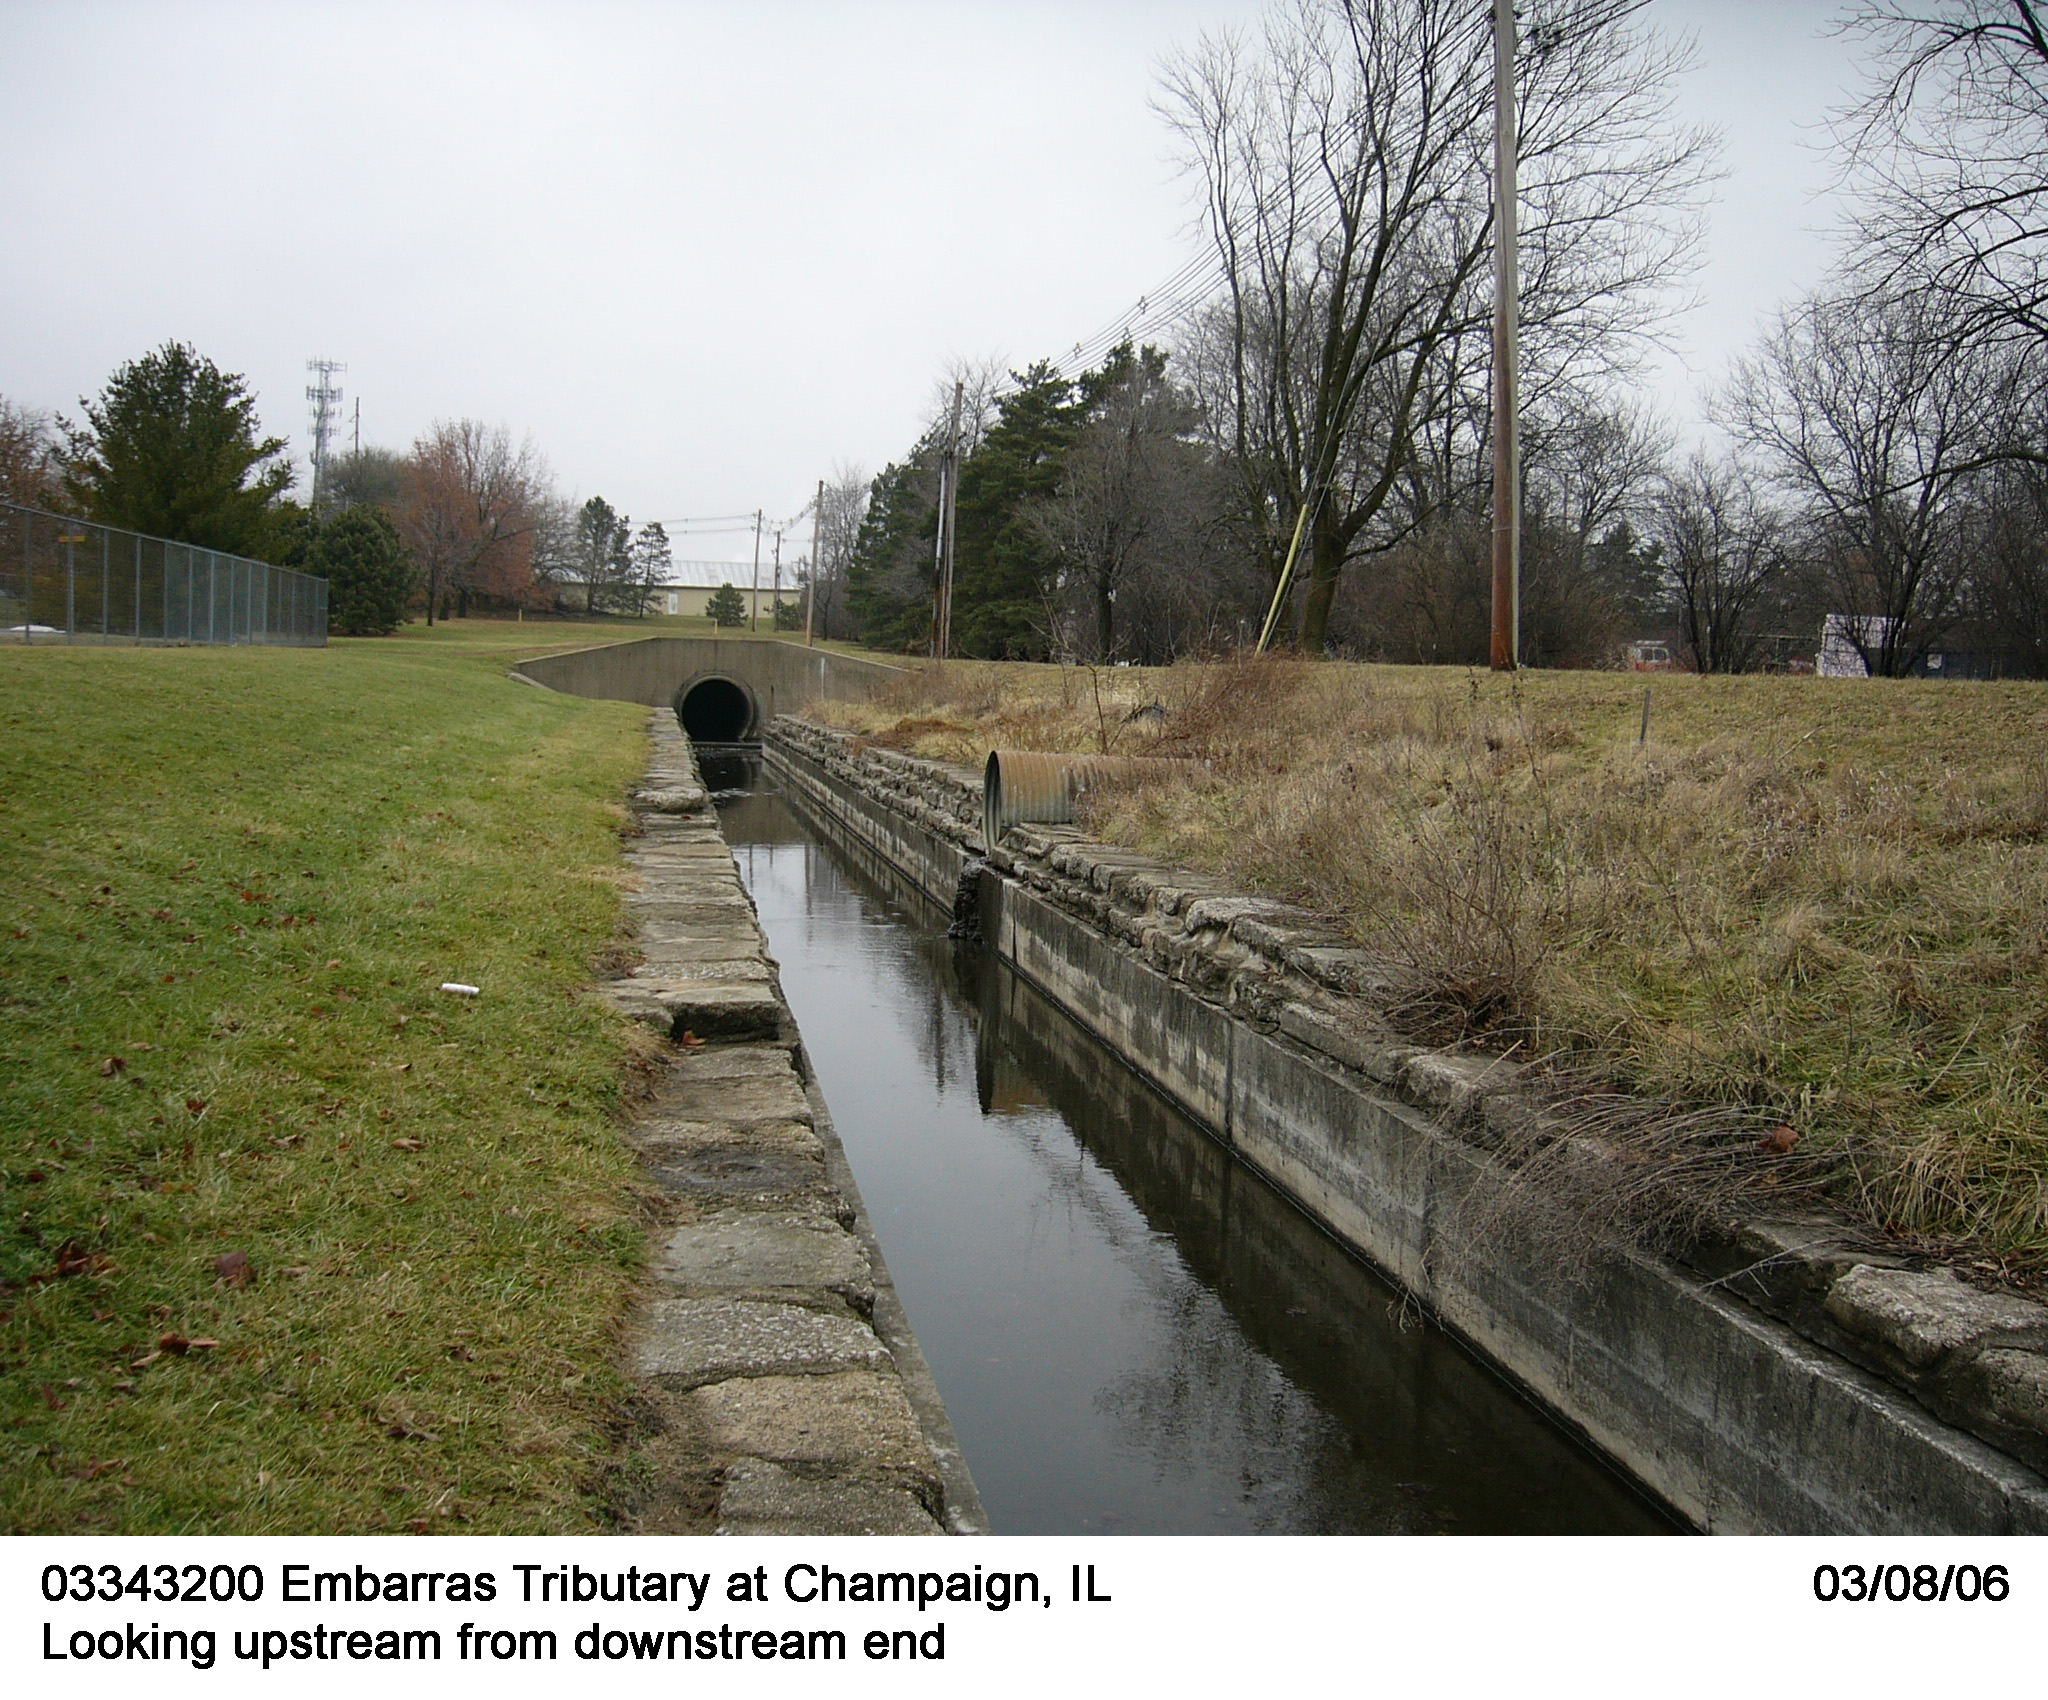
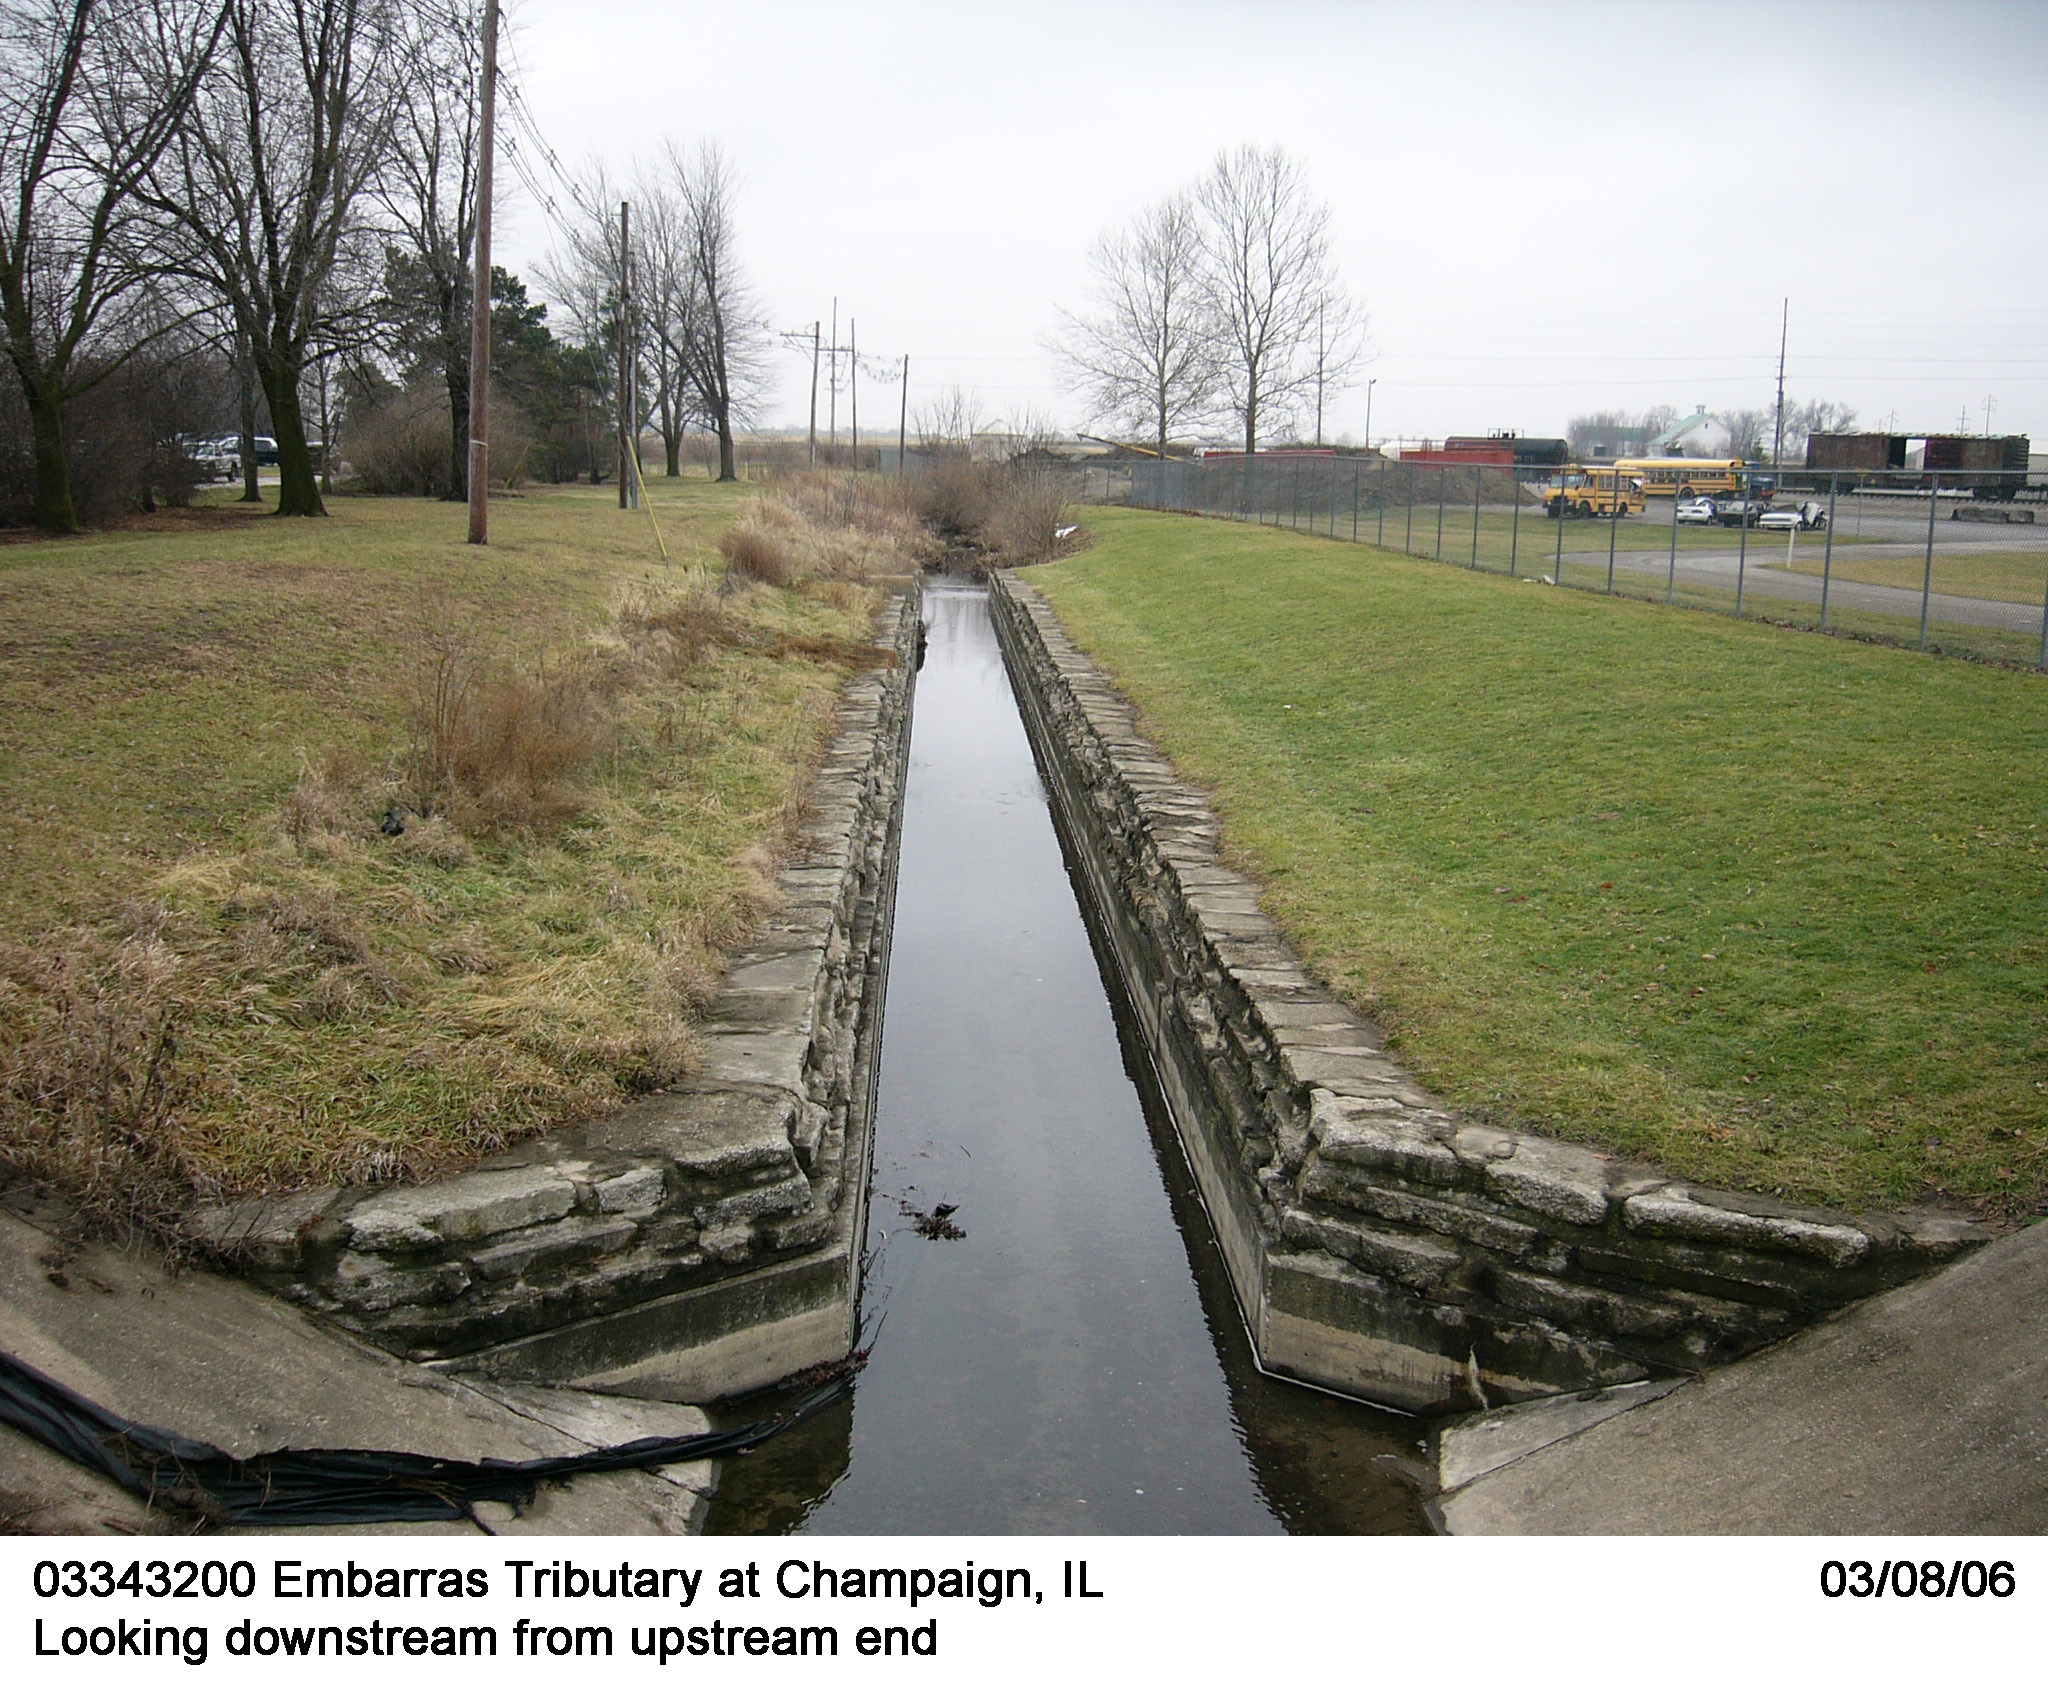
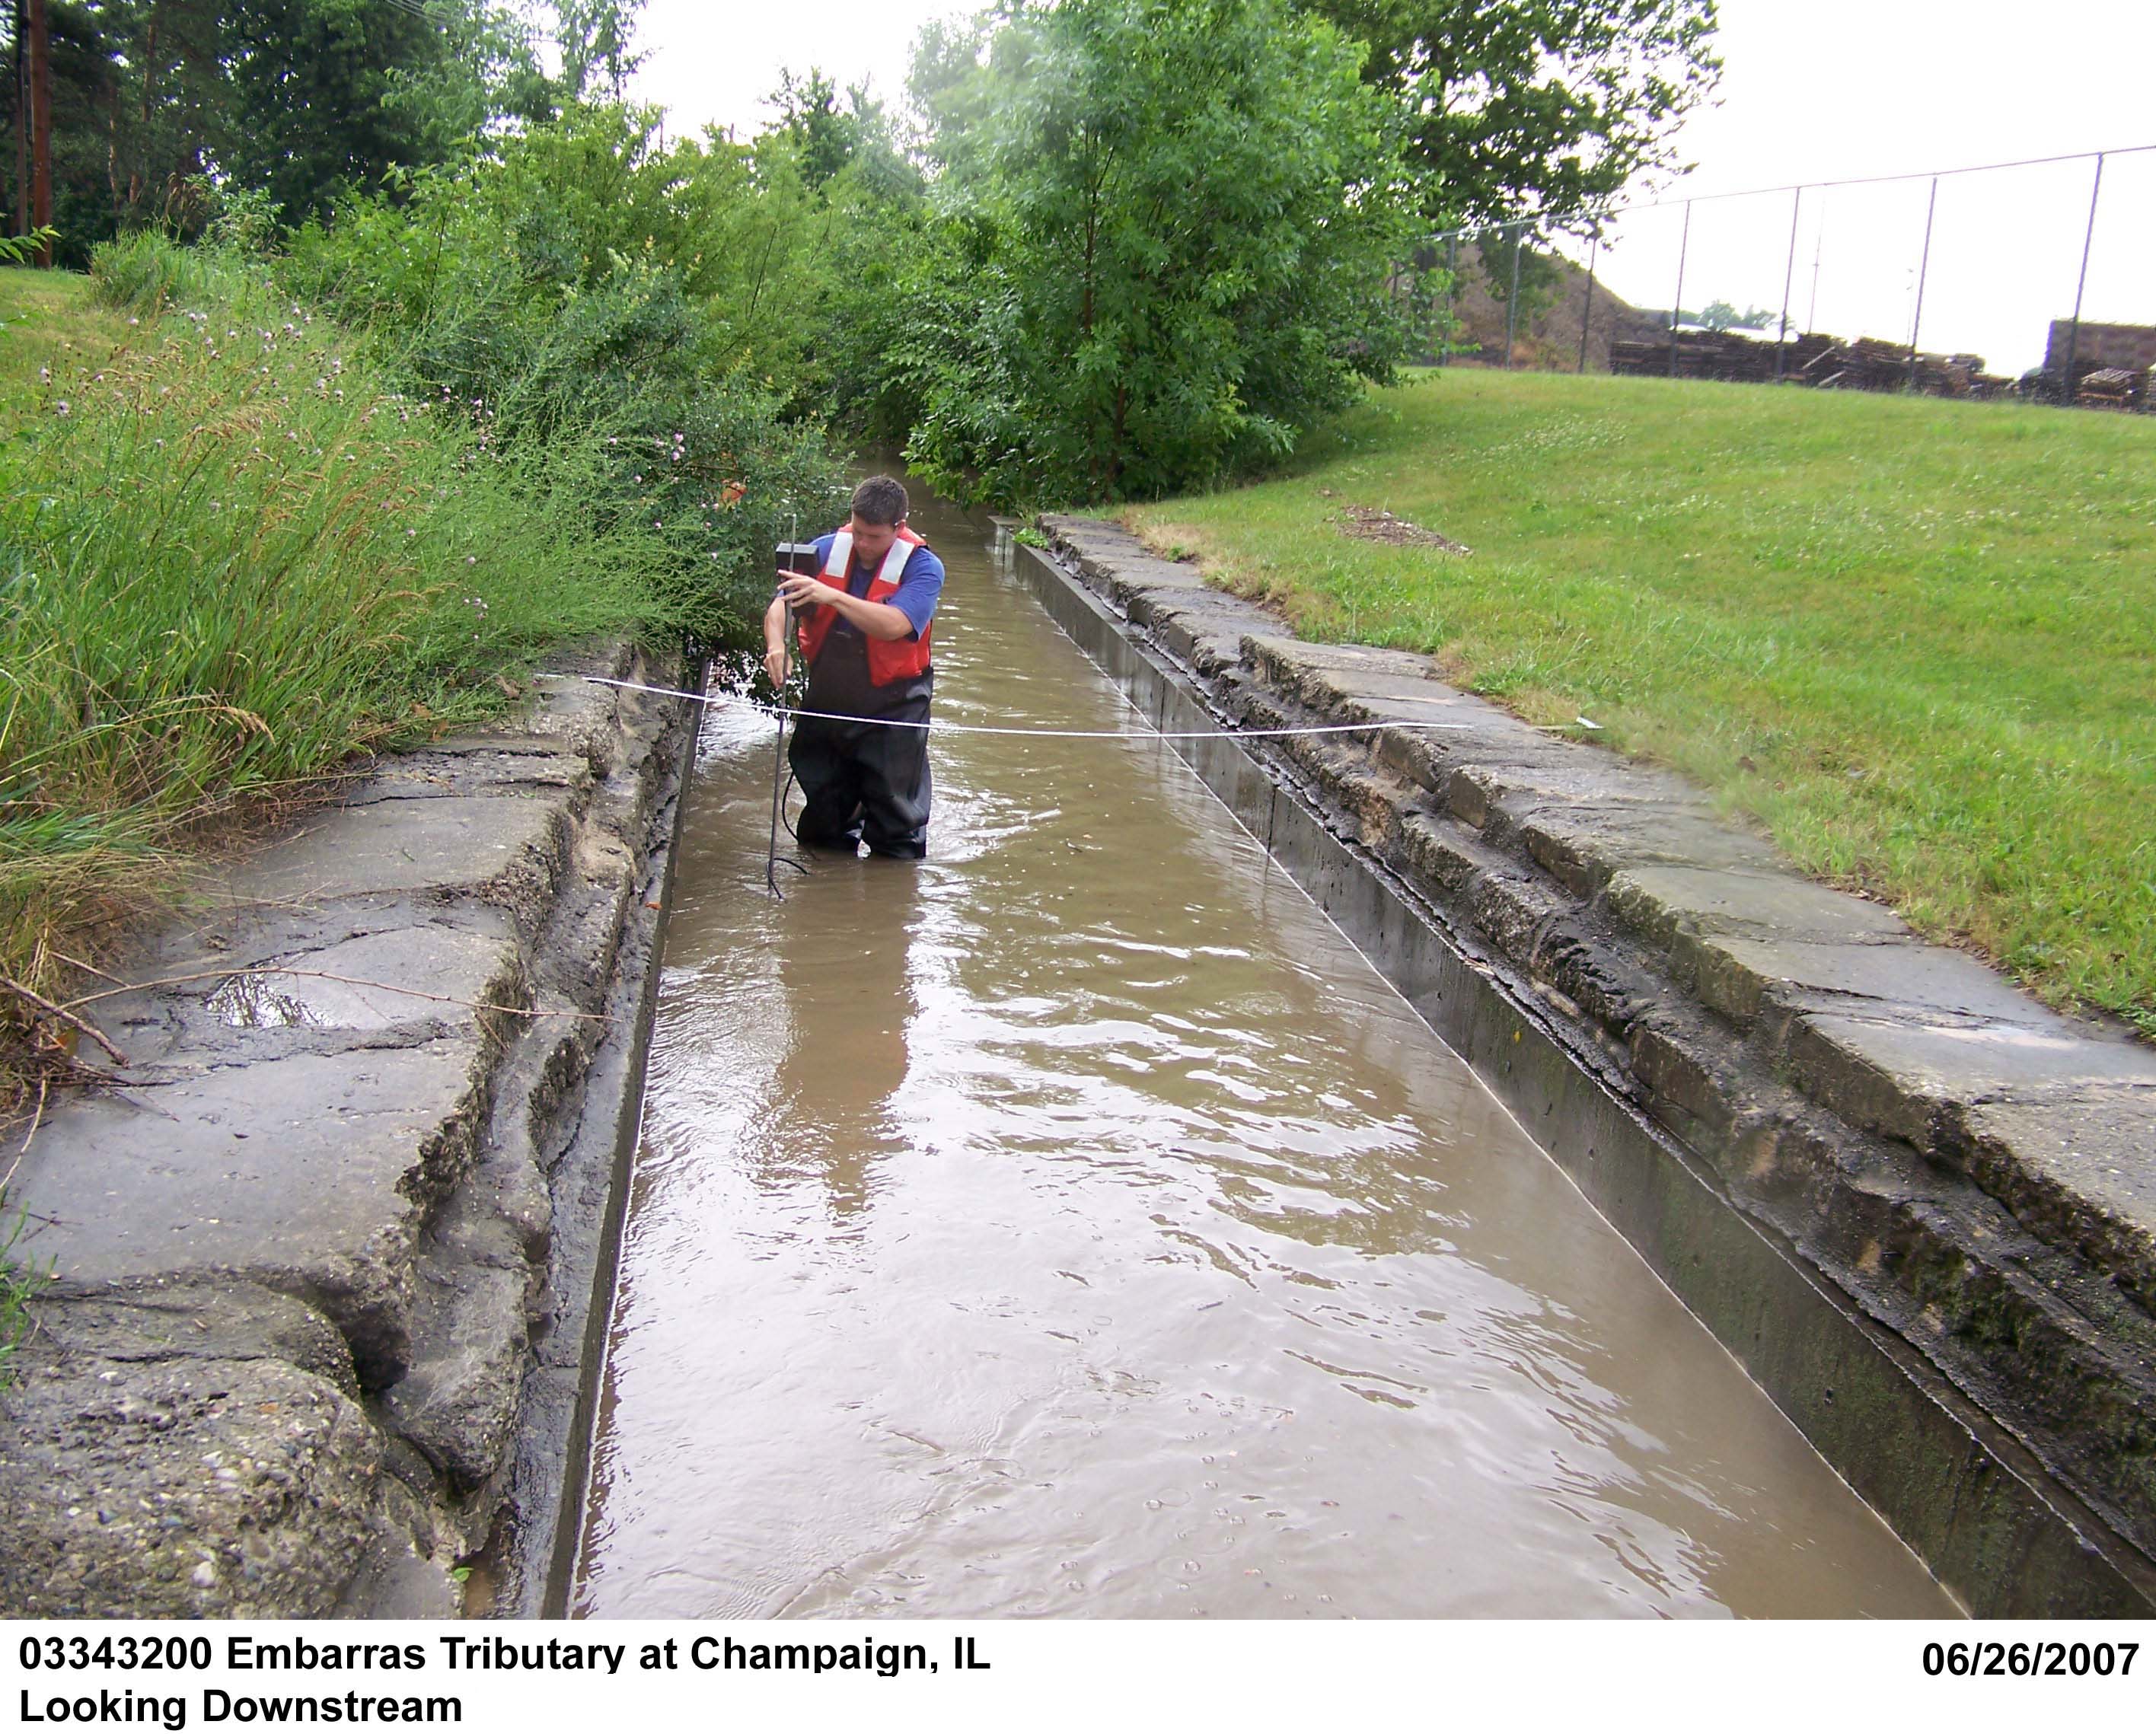
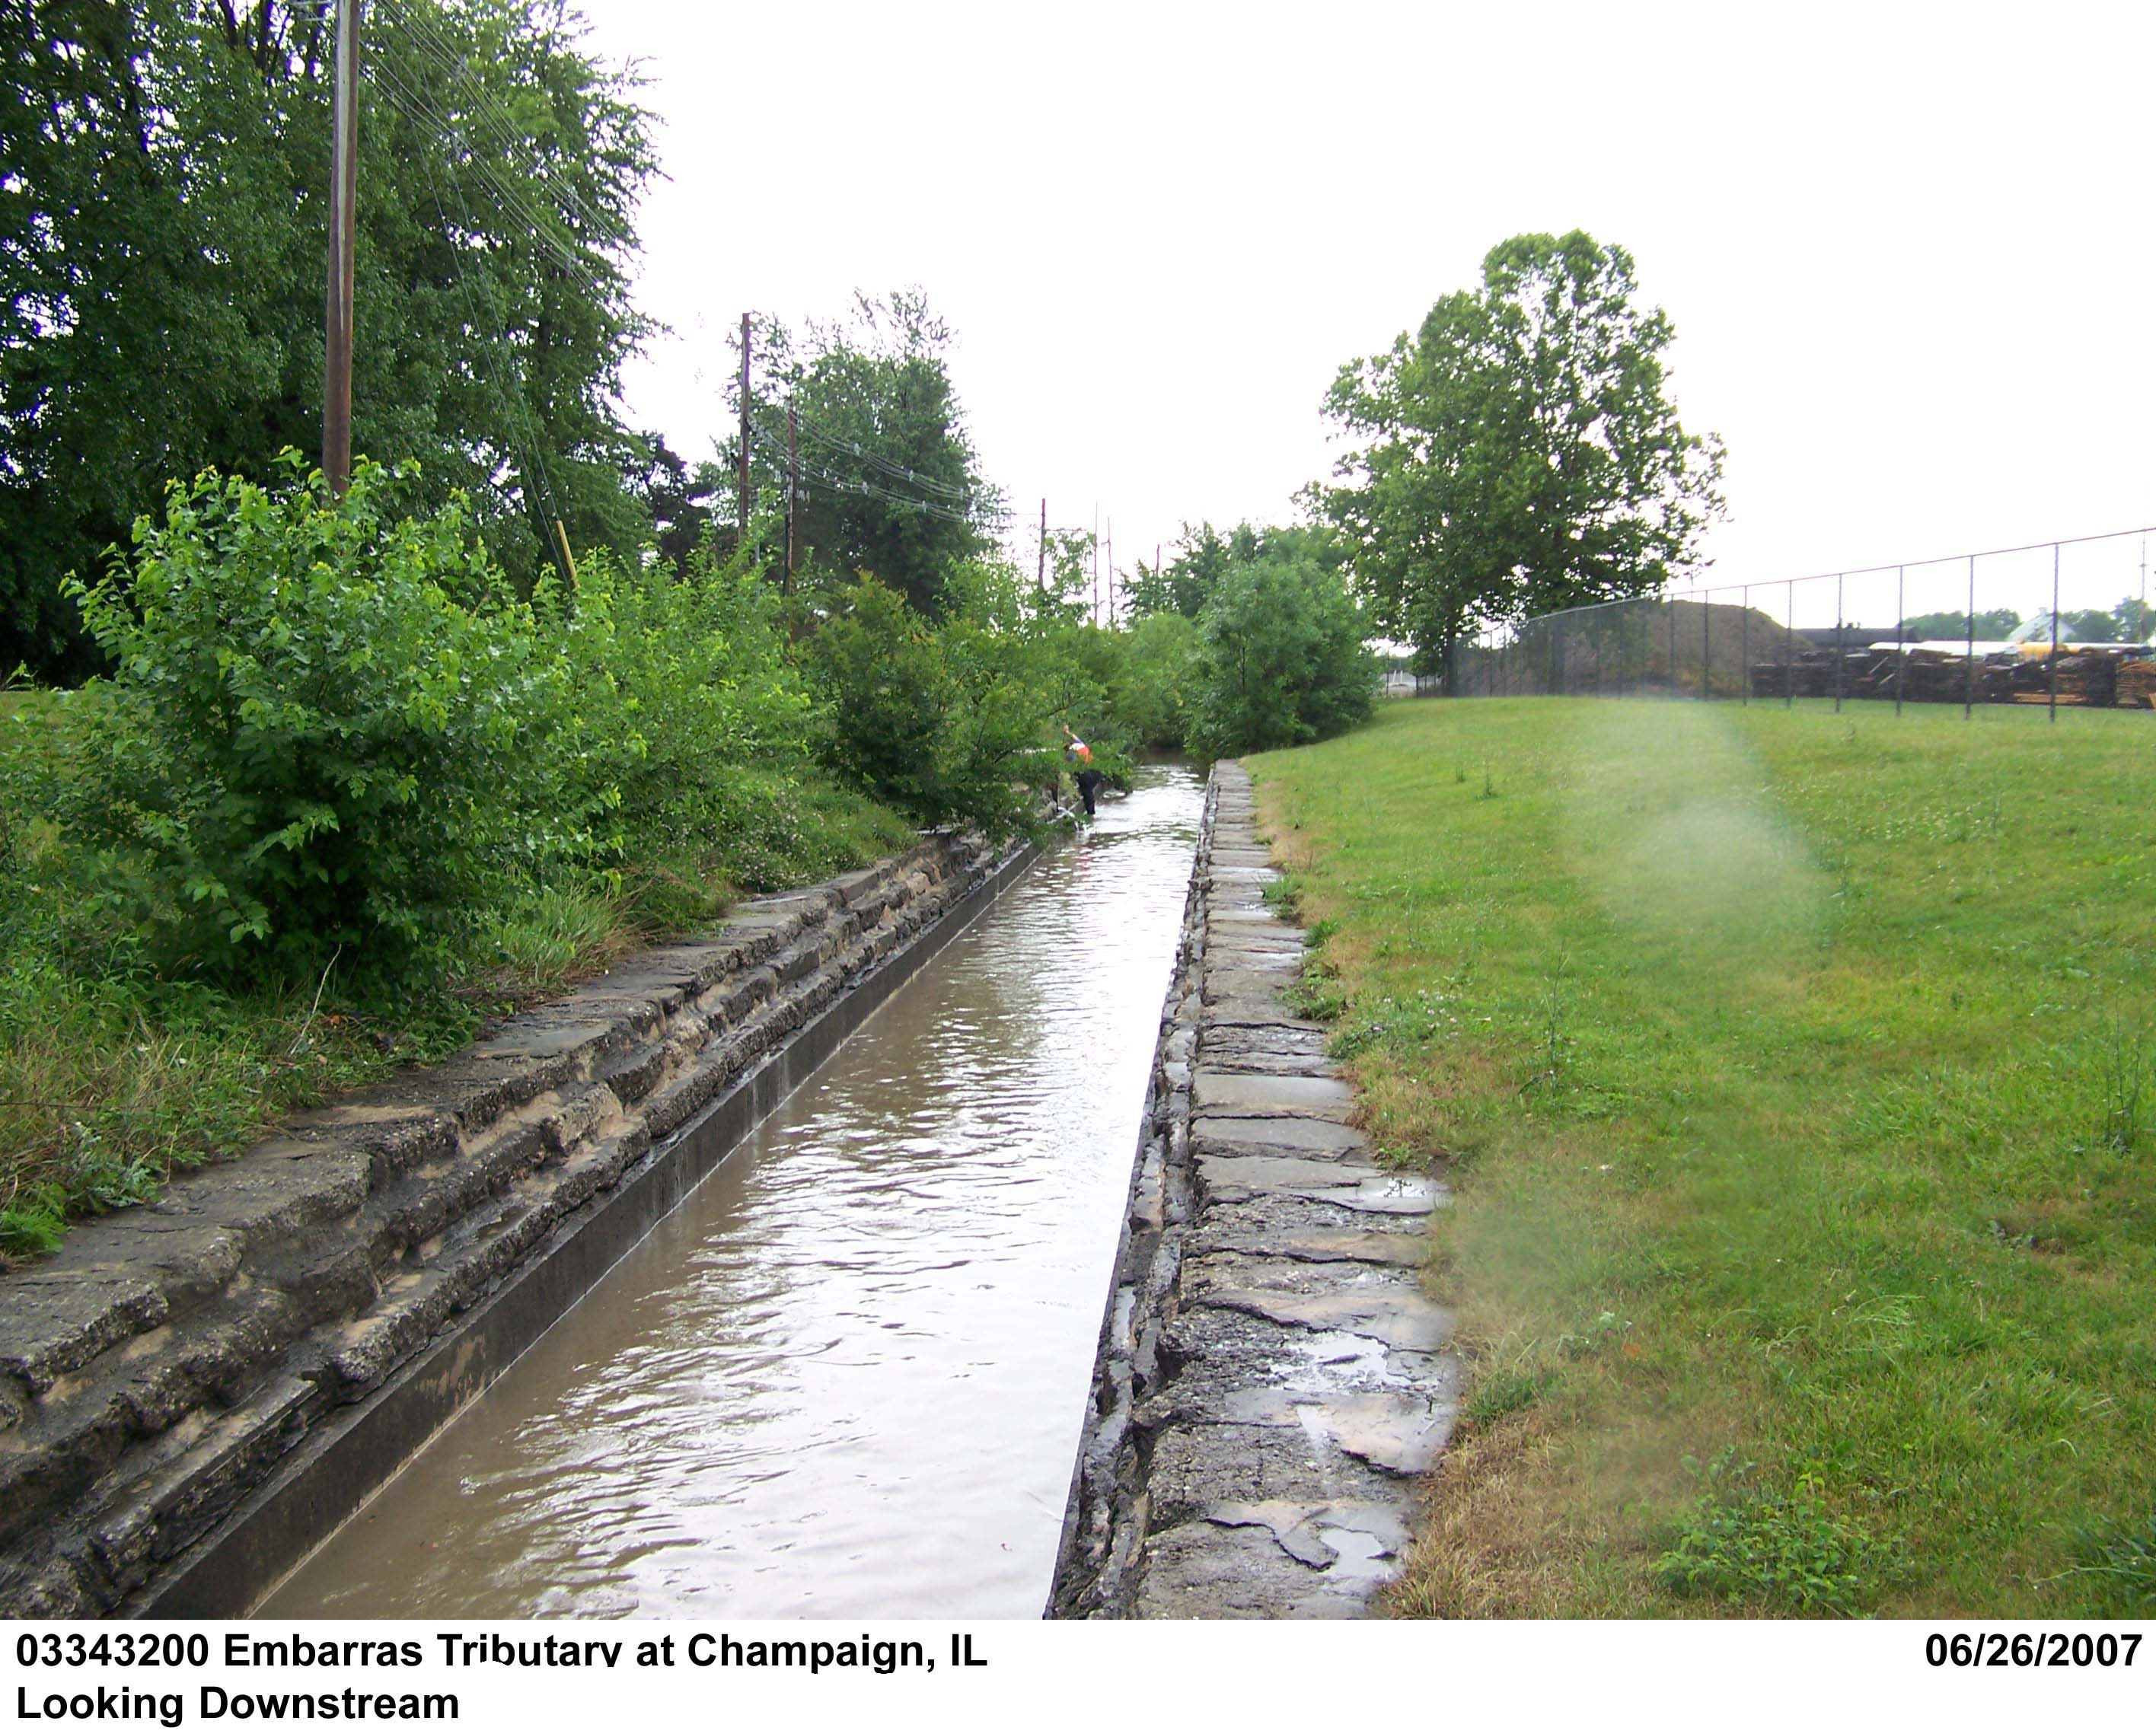

Description of Channel.--This is a man-made drainage ditch that collects run-off from portions of the University of Illinois campus and Research Park. The study reach begins from the downstream side of a broad-crested weir that is part of a concrete stilling basin, and connects to a natural ditch at the downstream end. Along the straight study reach there is a pipe outfall on the left-side, approximately 110 ft downstream of the weir. When flow from this pipe is apparent during an event, the study reach is shortened to upstream of the pipe to exclude its effects. The bed material consists of depositional silt and sand with algal and light grass growth during warm seasons. The study reach has rectangular cross-sectional geometry in the channel portion that is concrete-lined. The upper bank is layers of flag-stones, with each successive layer set back a few inches from the one below.
Floods.-- Not determined, not a regular USGS streamgage station

![]() U.S. Department of the Interior |
U.S. Geological Survey
U.S. Department of the Interior |
U.S. Geological Survey
URL: http://il.water.usgs.gov/proj/nvalues/db/sites/03343200.shtml[an error occurred while processing this directive]?
Page Contact Information: David Soong
Page Last Modified: February 4, 2013
