

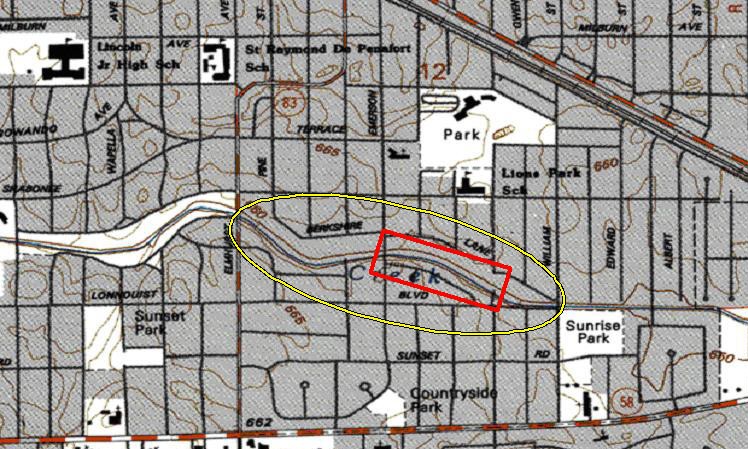
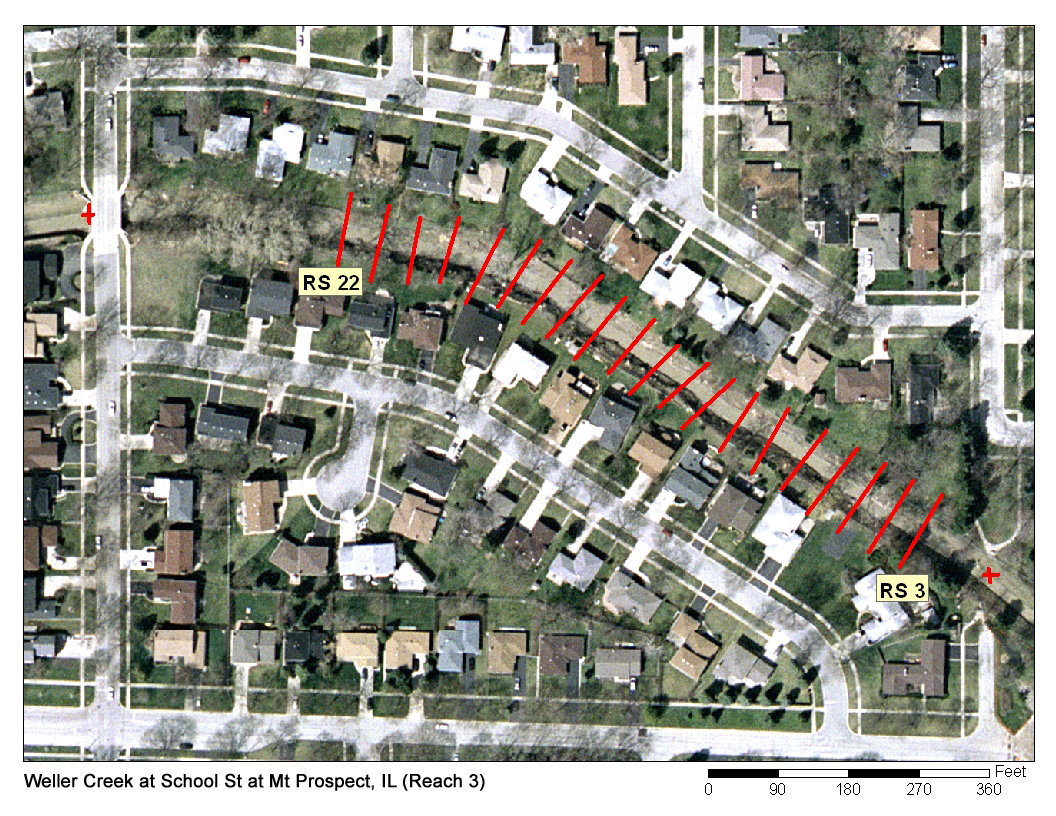
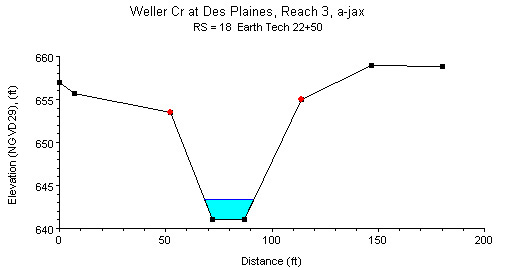
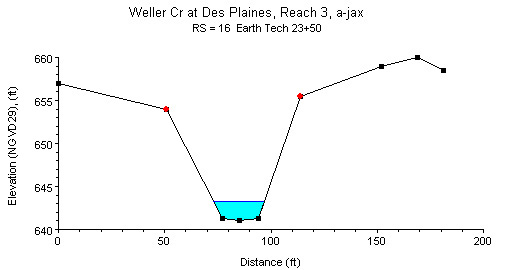
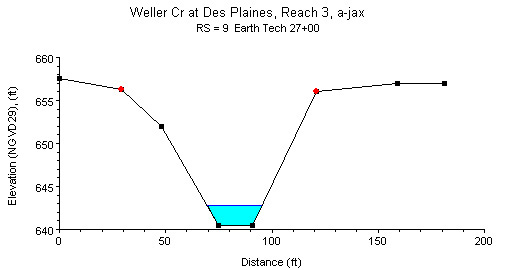

Study Reach.--The channel reach is constructed in an urban setting. The study reach, 1100 ft long, is located from the Emerson Street bridge to the School Street pedestrian footbridge, as shown in the quadrangle map on the top left. Cross-sectional geometries, as described by 22 surveyed cross sections (surveyed by Earth Tech, in July 2001) vary gradually and continuously from upstream to downstream. The general shapes of cross sections in the study reach are plotted above. The alignment of the study reach, approximate variations in channel width and bank conditions, and locations of the surveyed cross sections are shown in the aerial photograph on the top right.
Gage Location.--The location where discharge measurements are taken is lat 42°03�10�, long 87°55�54�. The study reach is located at SE1/4 SE1/4 SW1/4 sec.12, T.41N., R.11E., Cook County, Hydrologic Unit 07120004, on the right bank 10 ft upstream from the bridge on State Highway 58 (Golf Road) in Des Plaines, 2 mi west of US Highway 45 and at mile 4.0. The USGS streamgage station number is 05529985.
Drainage Area.--12.12 sq mi.
Gage Datum and Elevations of Reference Points.--Datum of the gage is 634.02 ft. Two reference points (RP-N) were established for the n-values project. RP-N5 is a bolt in the concrete guardrail on the upstream side of Emerson Street bridge located about midchannel, elevation = 657.989 ft. RP-N4 is two file marks on the upstream side of the bridge deck frame accessed through an opening in the bridge deck catwalk located just under the "X" formed by the guardrail diagonals on the School Street pedestrian bridge, elevation = 654.999 ft. All elevations are referenced to NGVD29.
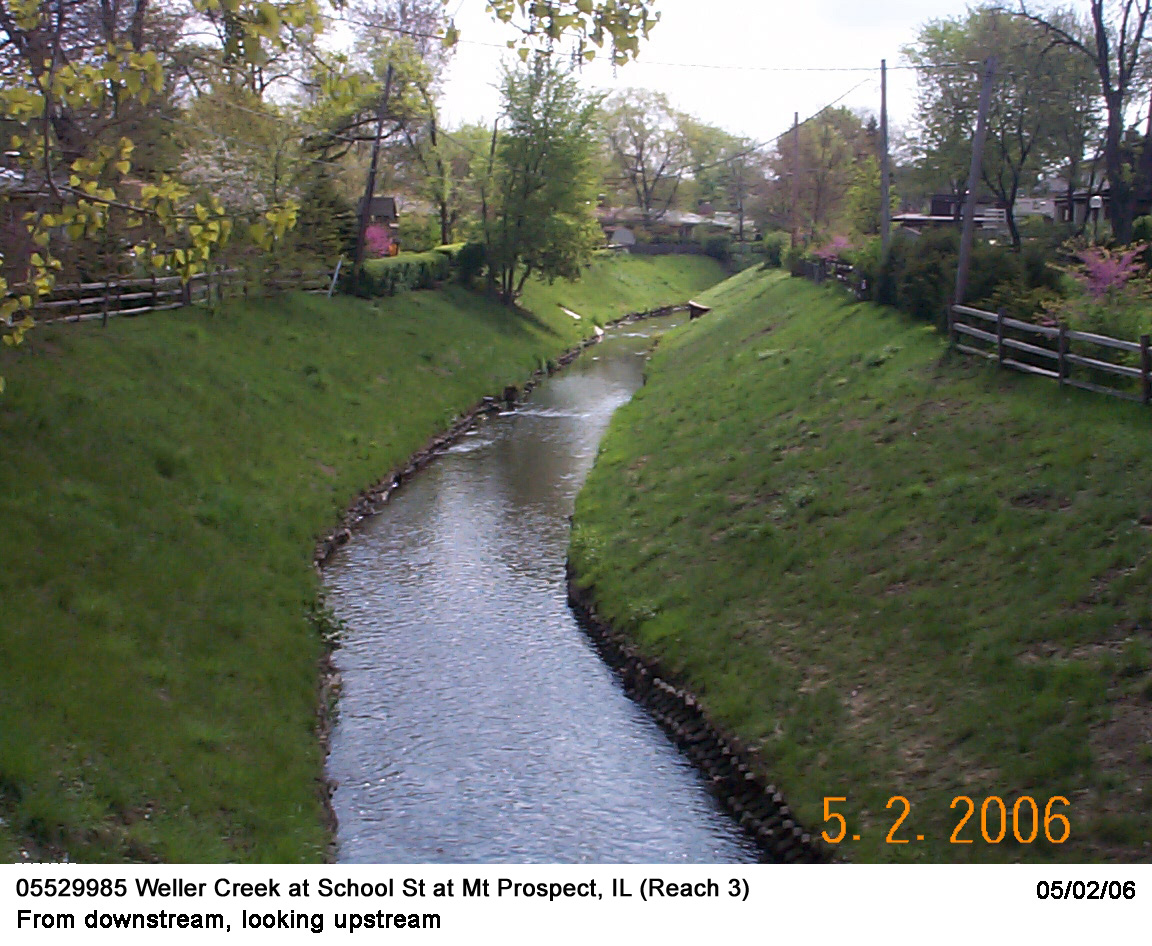
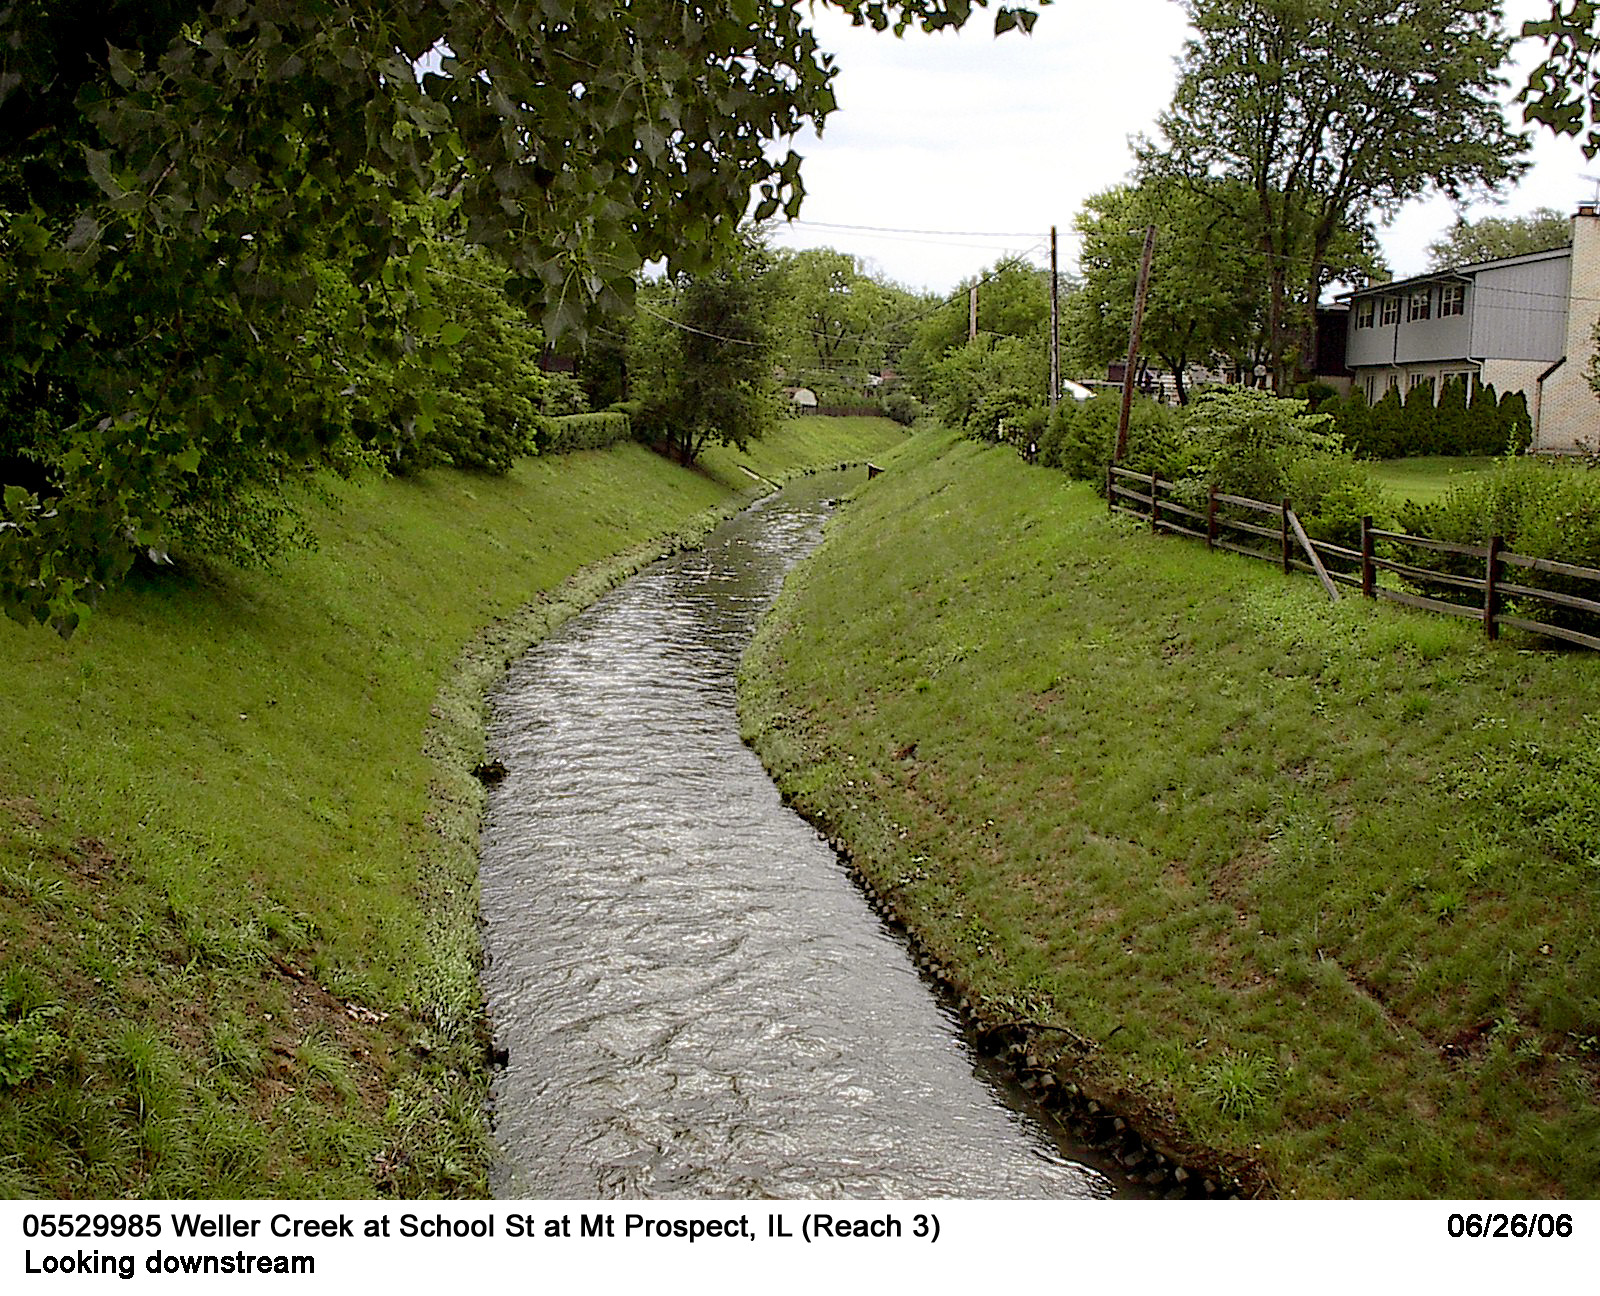
Stage, Discharge Measurements and Computed n-Values.--Water-surface elevations are made by taping down from RP-N4 on the upstream side of the School Street pedestrian bridge and from RP-N5 on the upstream side of the Emerson Street bridge before and after each discharge measurement. Discharge measurements are made on the downstream side of the Emerson Street bridge or by wading in the vicinity of the bridge. Discharge measurements are made using the conventional current-meter method. The computed n-values are listed in the following table. Whenever possible, the computed n-values are associated with a photograph taken at the time of the measurement. The photographs are arranged from low to high discharge in order to illustrate the contributing factors of n-values at a particular discharge.
| Date of Observation | Discharge (ft3/s) | Average Cross Section Area (ft2) | Hydraulic Radius (ft) | Mean Velocity (ft/s) | Slope (ft/ft) | Coefficient of Roughness n |
|---|---|---|---|---|---|---|
| 5/2/2006 | 8.4 | 18.9 | 0.96 | 0.50 | 0.001432 | 0.076 |
| 6/26/2006 | 62.0 | 33.3 | 1.48 | 2.05 | 0.000900 | 0.026 |
| 4/25/2007 | 66.6 | 34.2 | 1.50 | 2.14 | 0.000928 | 0.025 |
| 4/25/2007 | 73.4 | 36.0 | 1.56 | 2.23 | 0.000907 | 0.025 |
| 1/12/2005 | 88.0 | 41.8 | 1.73 | 2.29 | 0.000855 | 0.026 |
| 1/12/2005 | 89.9 | 40.6 | 1.73 | 2.42 | 0.000855 | 0.026 |

Description of Channel.--This channel has been modified. Streambed material consists of coarse sand and gravel. The bank consists of interlocking 24-inch A-jacks at the toe with tall grass and weeds anchored in geoweb fabric. The bottom width of the channel ranges from 10 to 20 ft. Top width ranges from about 50 to 70 ft. The banks are steep with an average height of about 14 ft. The cross sections are fairly uniform and nearly trapezoidal. The channel curves gently to the right over the entire reach.
Floods.--Maximum discharge during period of record, 1,590 ft3/s on June 10, 1967, gage height, 15.09 ft.

![]() U.S. Department of the Interior |
U.S. Geological Survey
U.S. Department of the Interior |
U.S. Geological Survey
URL: http://il.water.usgs.gov/proj/nvalues/db/sites/05529985.shtml[an error occurred while processing this directive]?
Page Contact Information: David Soong
Page Last Modified: February 4, 2013
