

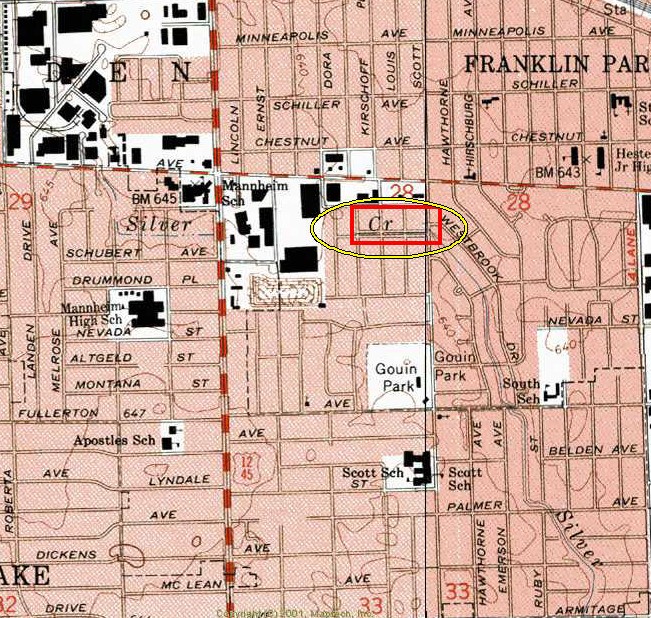
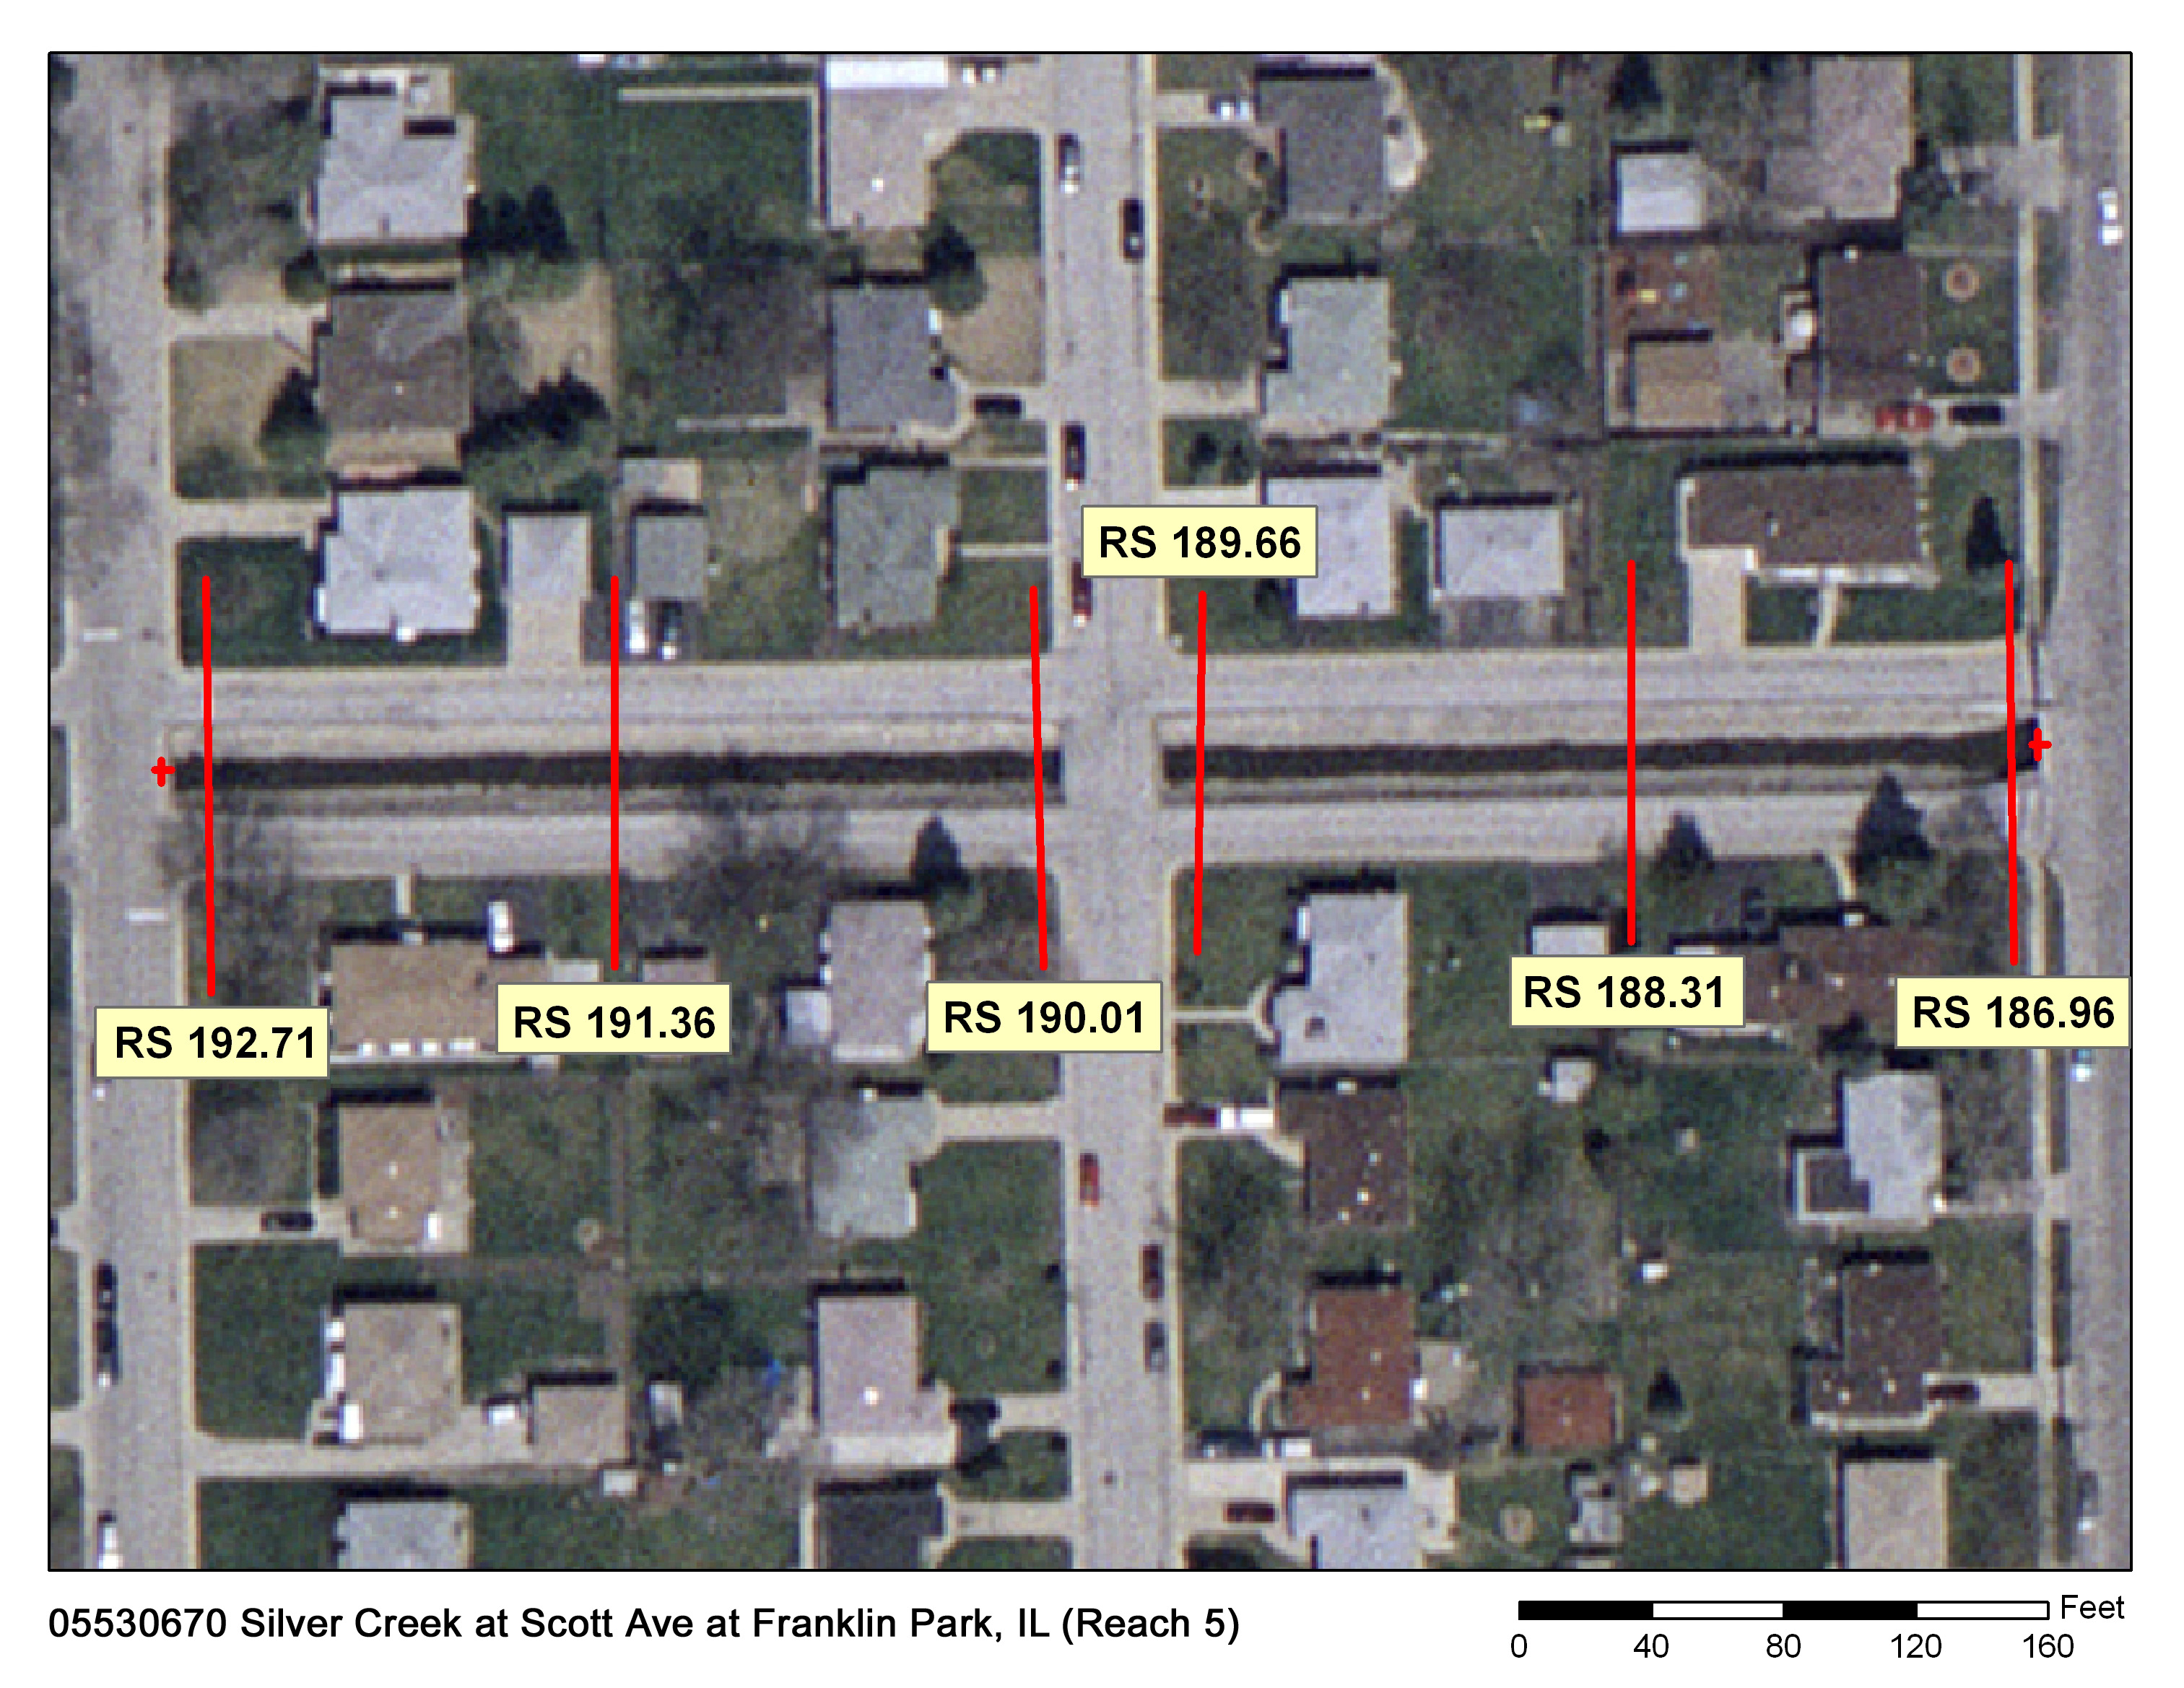
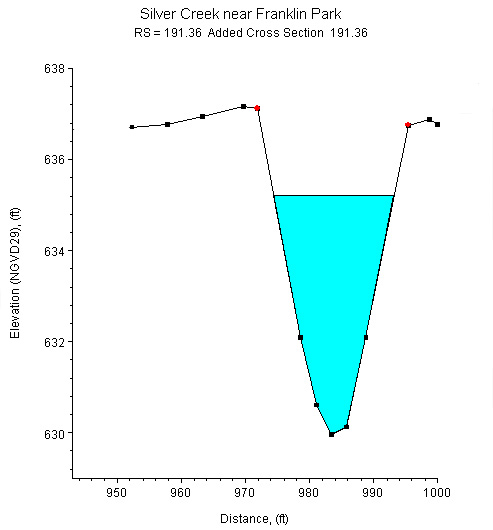
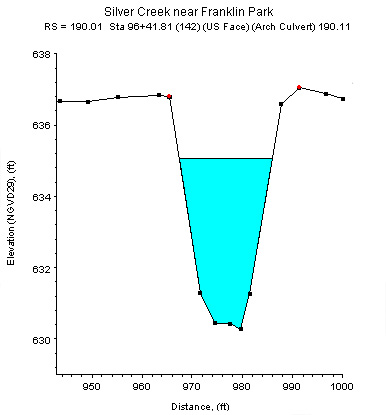
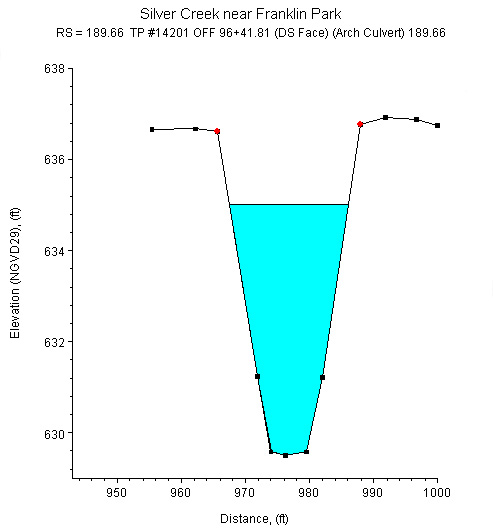
Study Reach.--The channel reach is a constructed channel in an urban area. The study reach, 575 ft long, is located between the downstream side of the Park Street bridge (a culvert) to the upstream side of the Scott Street bridge, as shown in the quadrangle map on the top left. Six surveyed cross sections (surveyed by the Illinois Department of Natural Resources in 1995) are available to evaluate channel geometries in the study reach. The channel alignment, approximate variations in channel width and bank conditions, and locations of surveyed cross sections are shown in the aerial photograph on the top right. The general shapes of the cross sections vary gradually and continuously from upstream to downstream (see plots above).
Gage Location.--The location where discharge measurements are made is lat 41°55�42�, long 87°52�30�. The general location of the study reach is NW1/4 NW1/4 SW1/4 sec.28, T.40N, R.12E, Cook County, Hydrologic Unit 07120004. The USGS streamgage station number is 05530670.
Drainage Area.--8.51 sq mi.
Gage Datum and Elevations of Reference Points.--Reference points (RP-N) were established for the n-value study. RP-N10 is two file marks on the center I-beam on the downstream side of the Park Street bridge, elevation=639.12 ft. RP-N9 is two file marks on the center I-beam on the upstream side of the Louis Street bridge, elevation=639.90 ft. RP-N8 is two file marks on the center I-beam on the downstream side of the Louis Street bridge, elevation=639.86 ft. RP-N7 is the top of a bolt in the left upstream concrete culvert abutment on Scott Street, elevation=636.65 ft. All elevations are referenced to NGVD29.
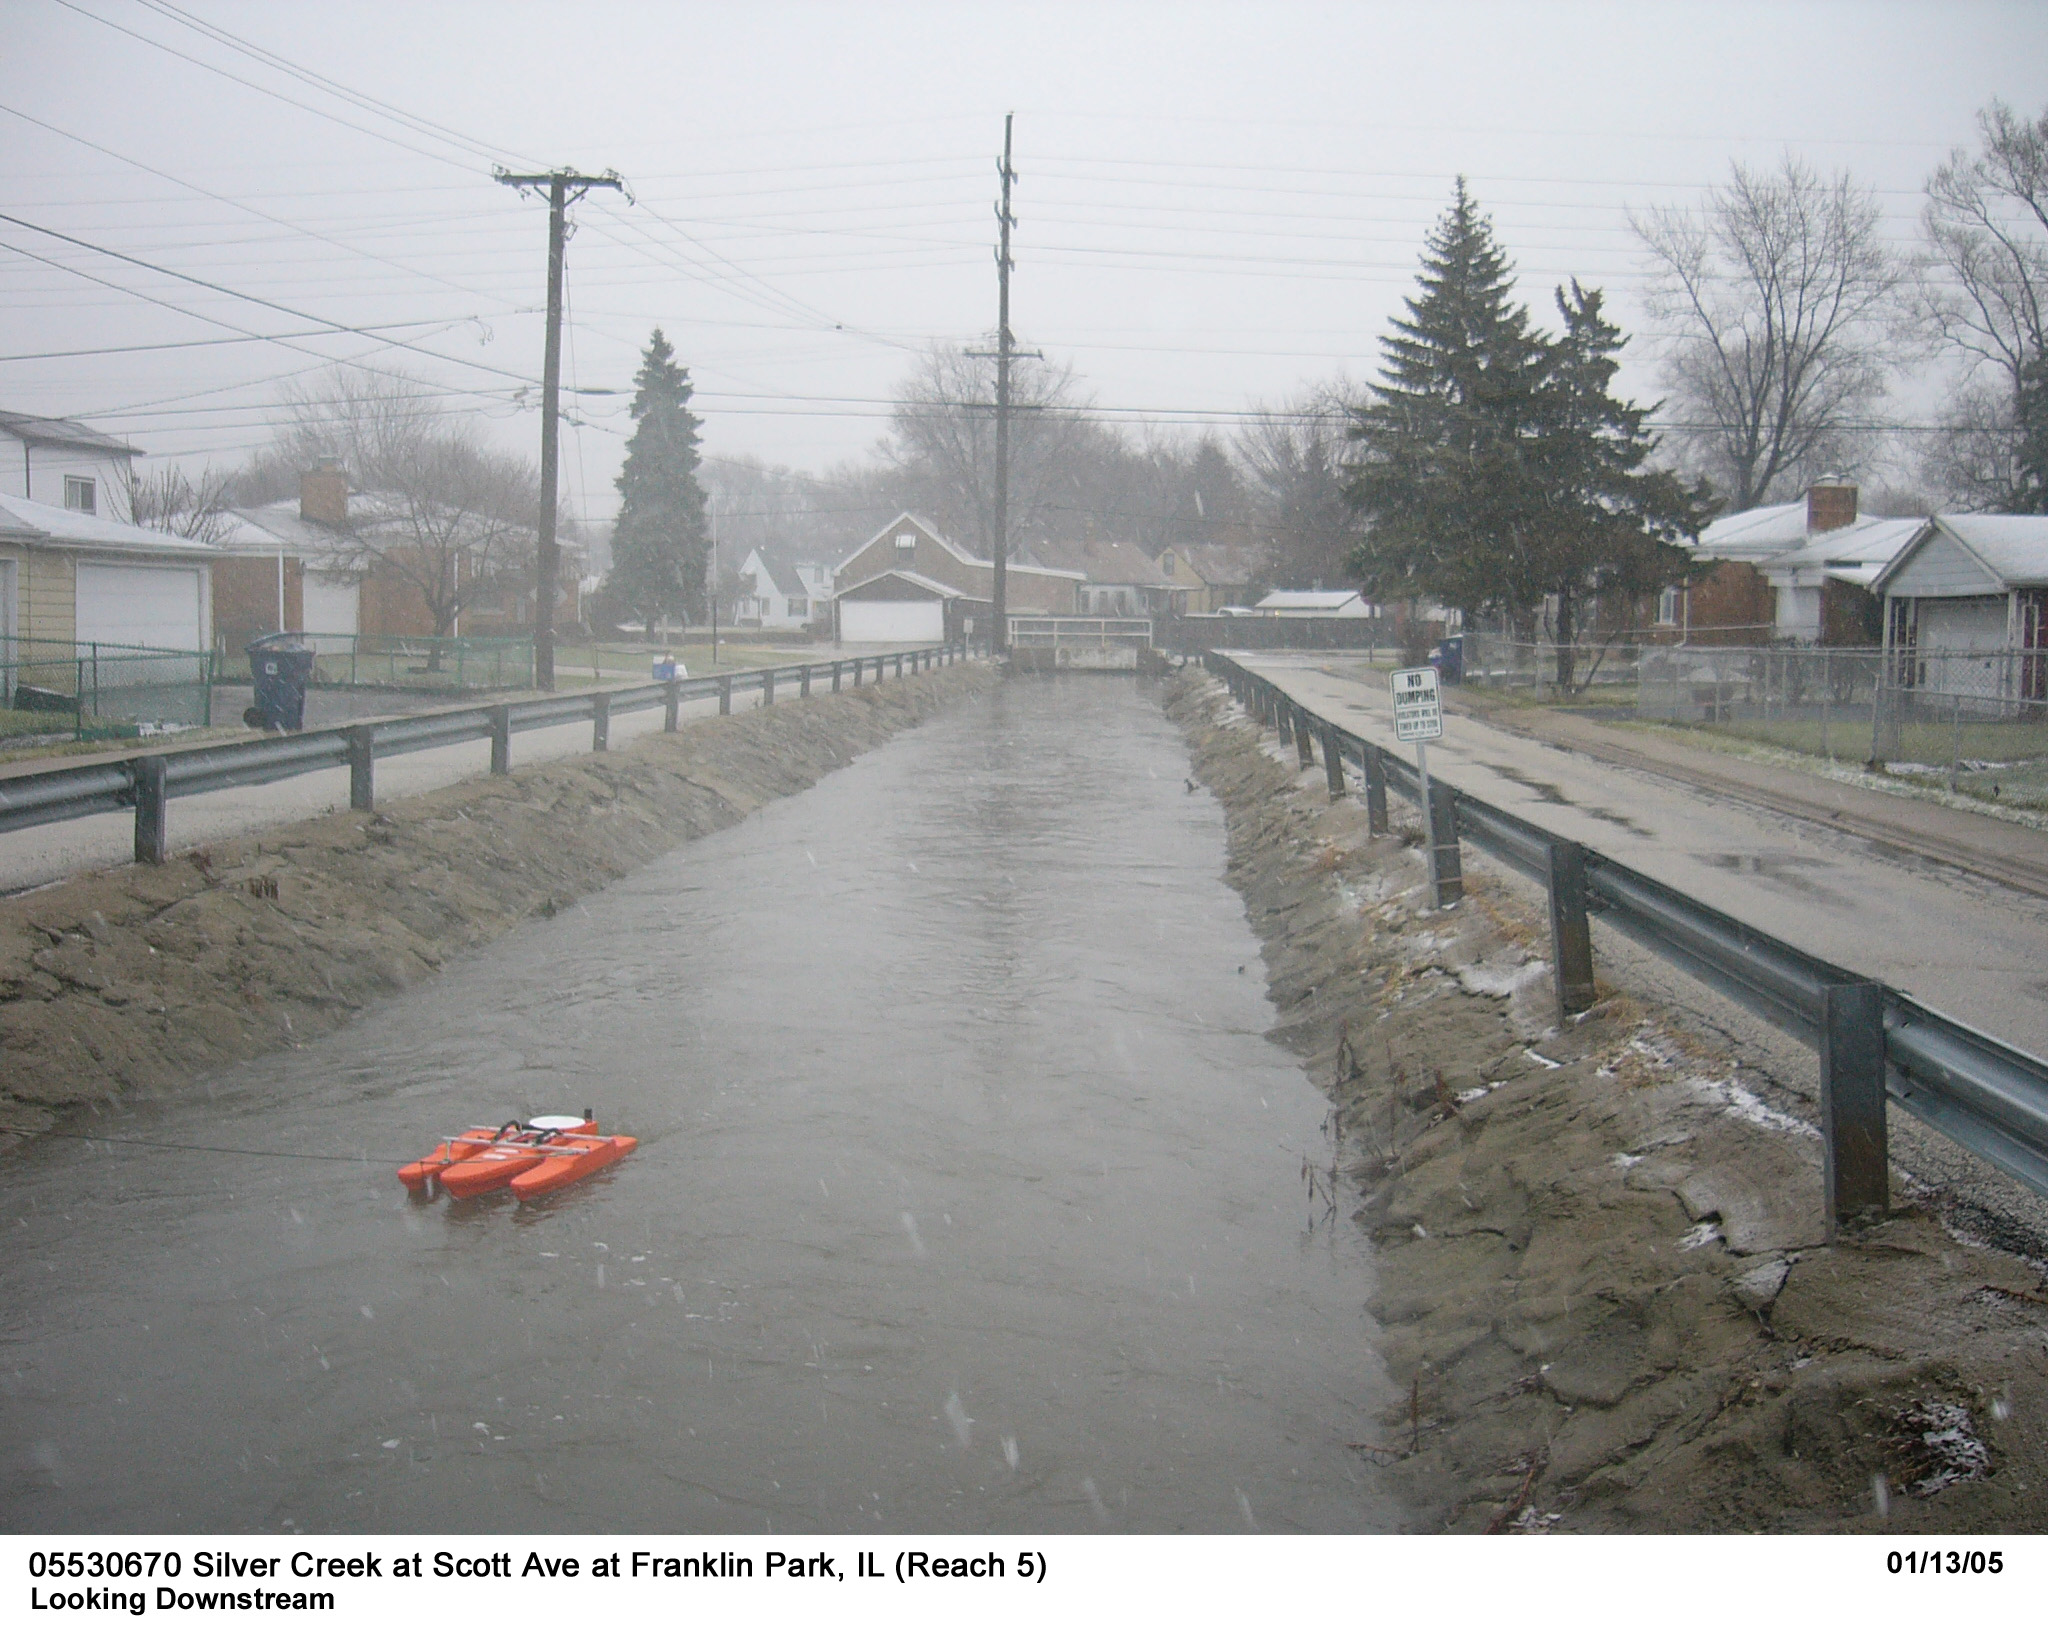
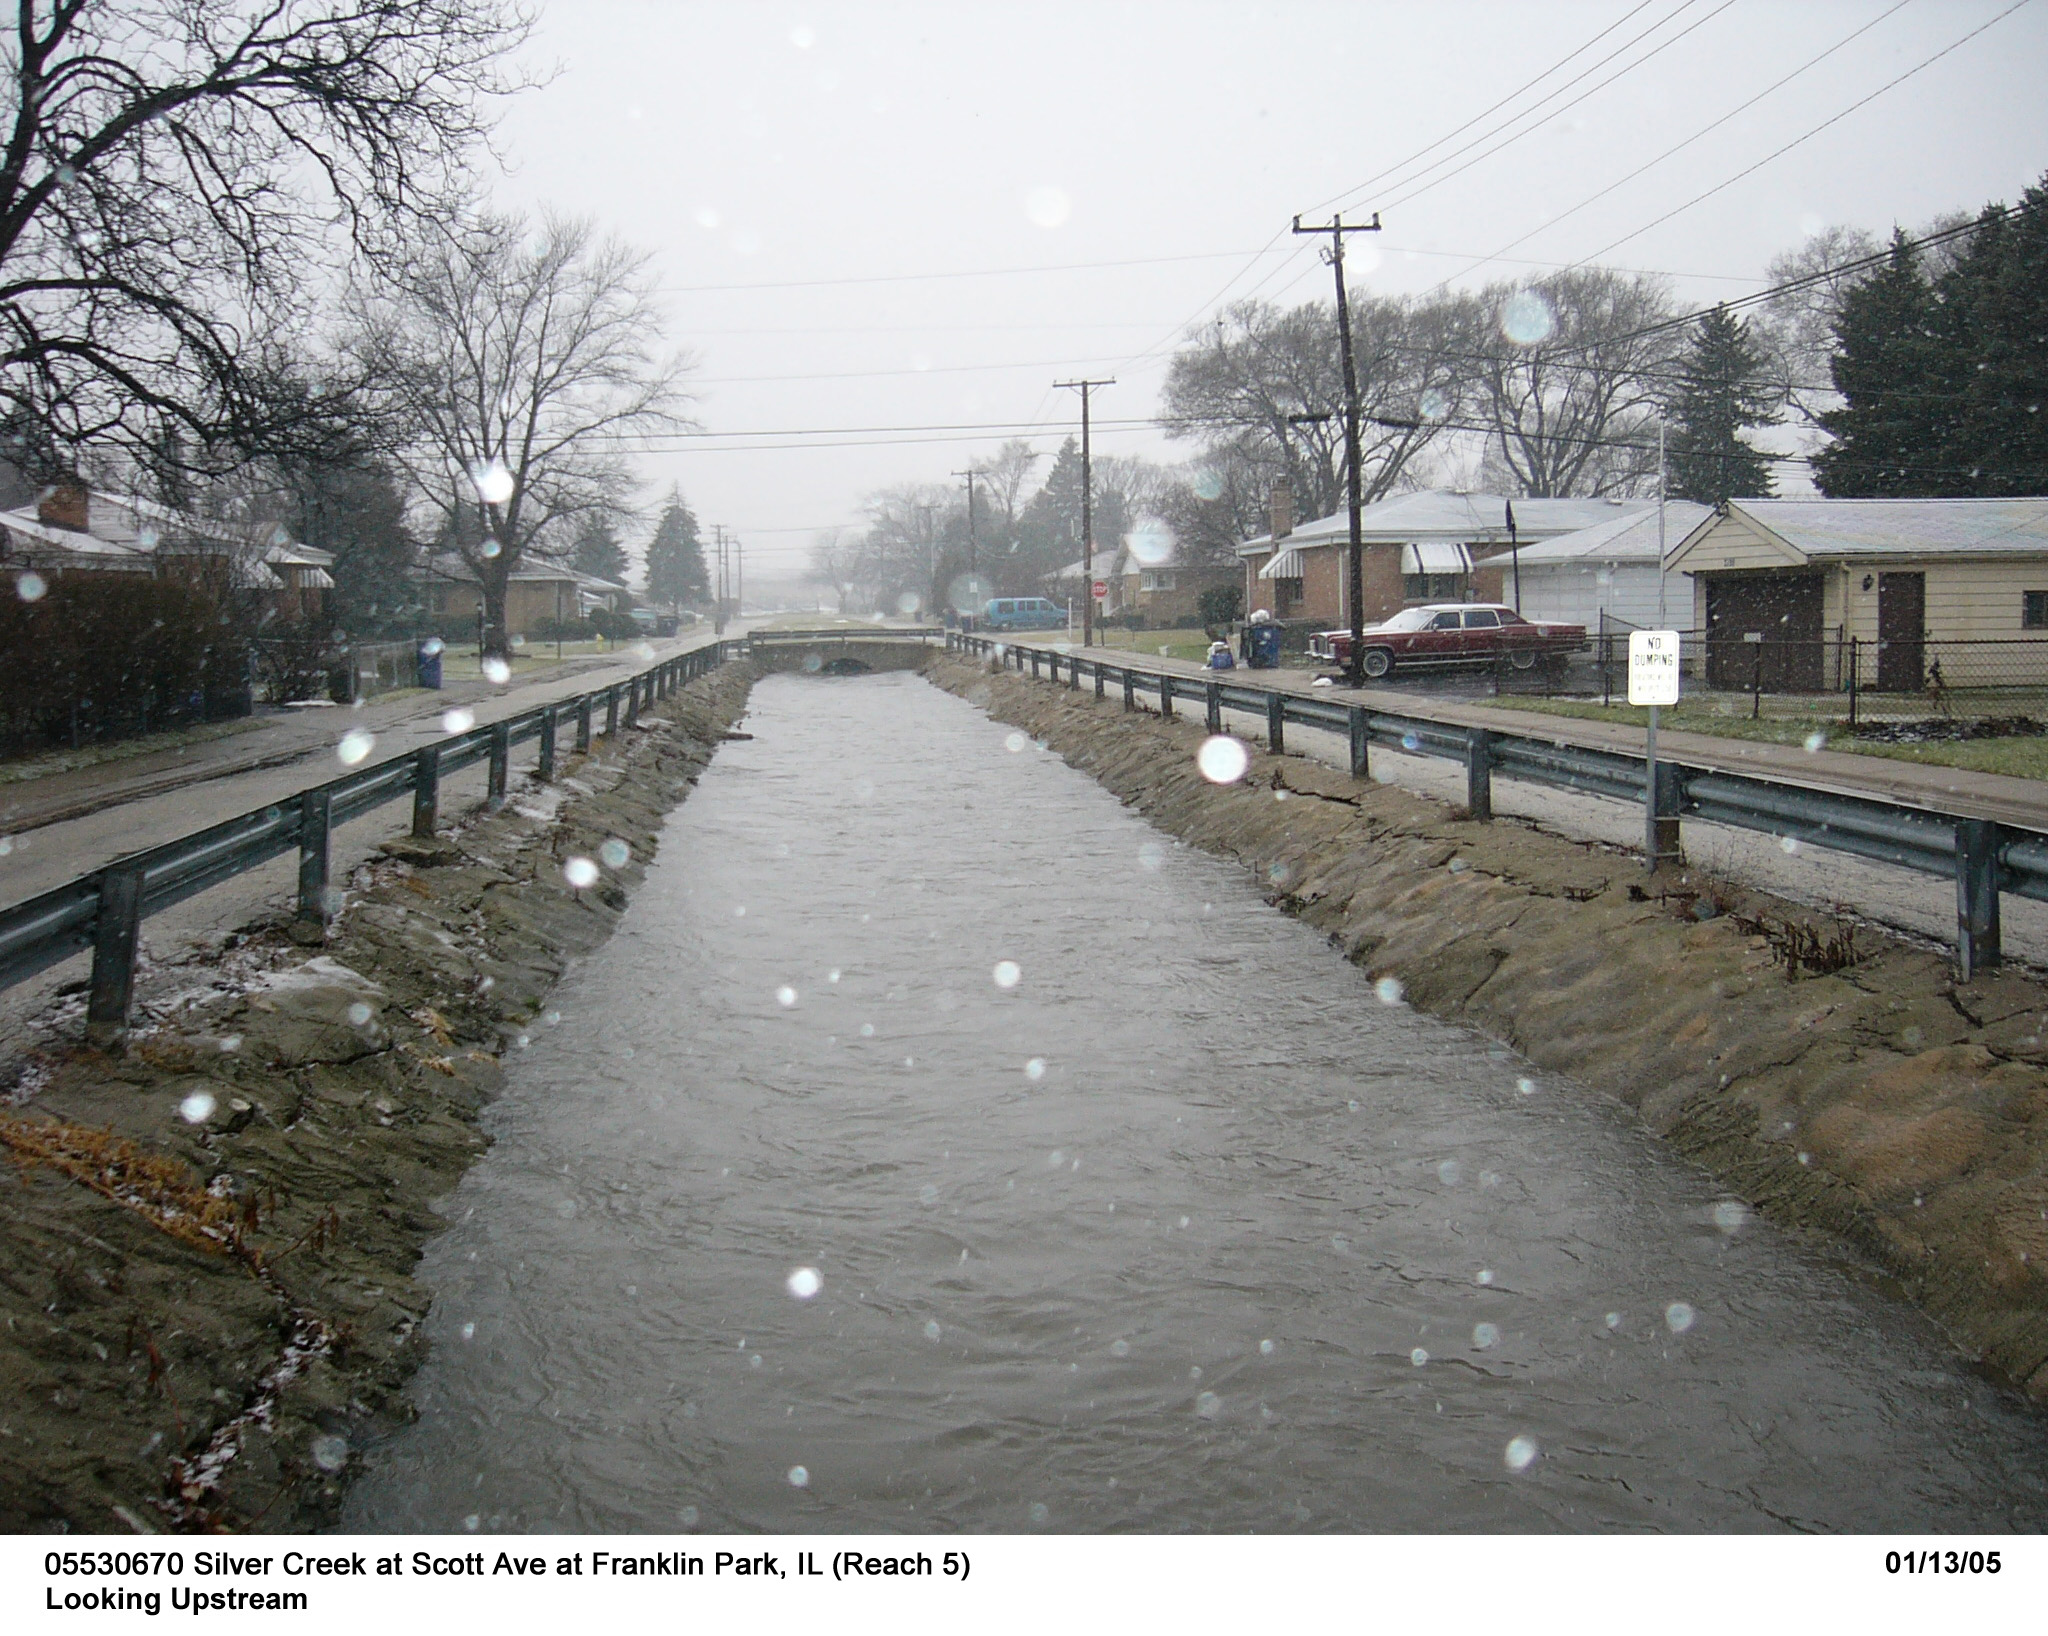
Stage, Discharge Measurements, and Computed n-Values.--Water-surface elevations were measured from the established reference points before and after each discharge measurement. Discharge measurements were made using an Acoustic Doppler Current Profiler (ADCP) or using the conventional current-meter method. At medium to high flows, discharges were measured from the Scott Street bridge or the Louis Street bridge. The culvert openings may become the control at high water stages and affect the water-surface elevation readings upstream. Therefore, no events under these conditions were used for this study. The computed n-values are listed in the following table. Whenever possible, the computed n-values are associated with a photograph taken at the time of the measurement. The photographs are arranged from low to high discharge in order to illustrate the contributing factors of n-values at a particular discharge.
| Date of Observation | Discharge (ft3/s) | Average Cross Section Area (ft2) | Hydraulic Radius (ft) | Mean Velocity (ft/s) | Slope (ft/ft) | Coefficient of Roughness n |
|---|---|---|---|---|---|---|
| 5/2/2006 | 19.6 | 26.7 | 1.96 | 0.77 | 0.001098 | 0.105 |
| 6/26/2006 | 30.6 | 31.3 | 2.20 | 1.04 | 0.001108 | 0.086 |
| 4/25/2007 | 89.0 | 44.2 | 2.76 | 2.17 | 0.001256 | 0.053 |
| 4/25/2007 | 89.0 | 44.4 | 2.77 | 2.15 | 0.001257 | 0.053 |
| 1/13/2005 | 134.0 | 50.7 | 3.13 | 2.97 | 0.001217 | 0.042 |
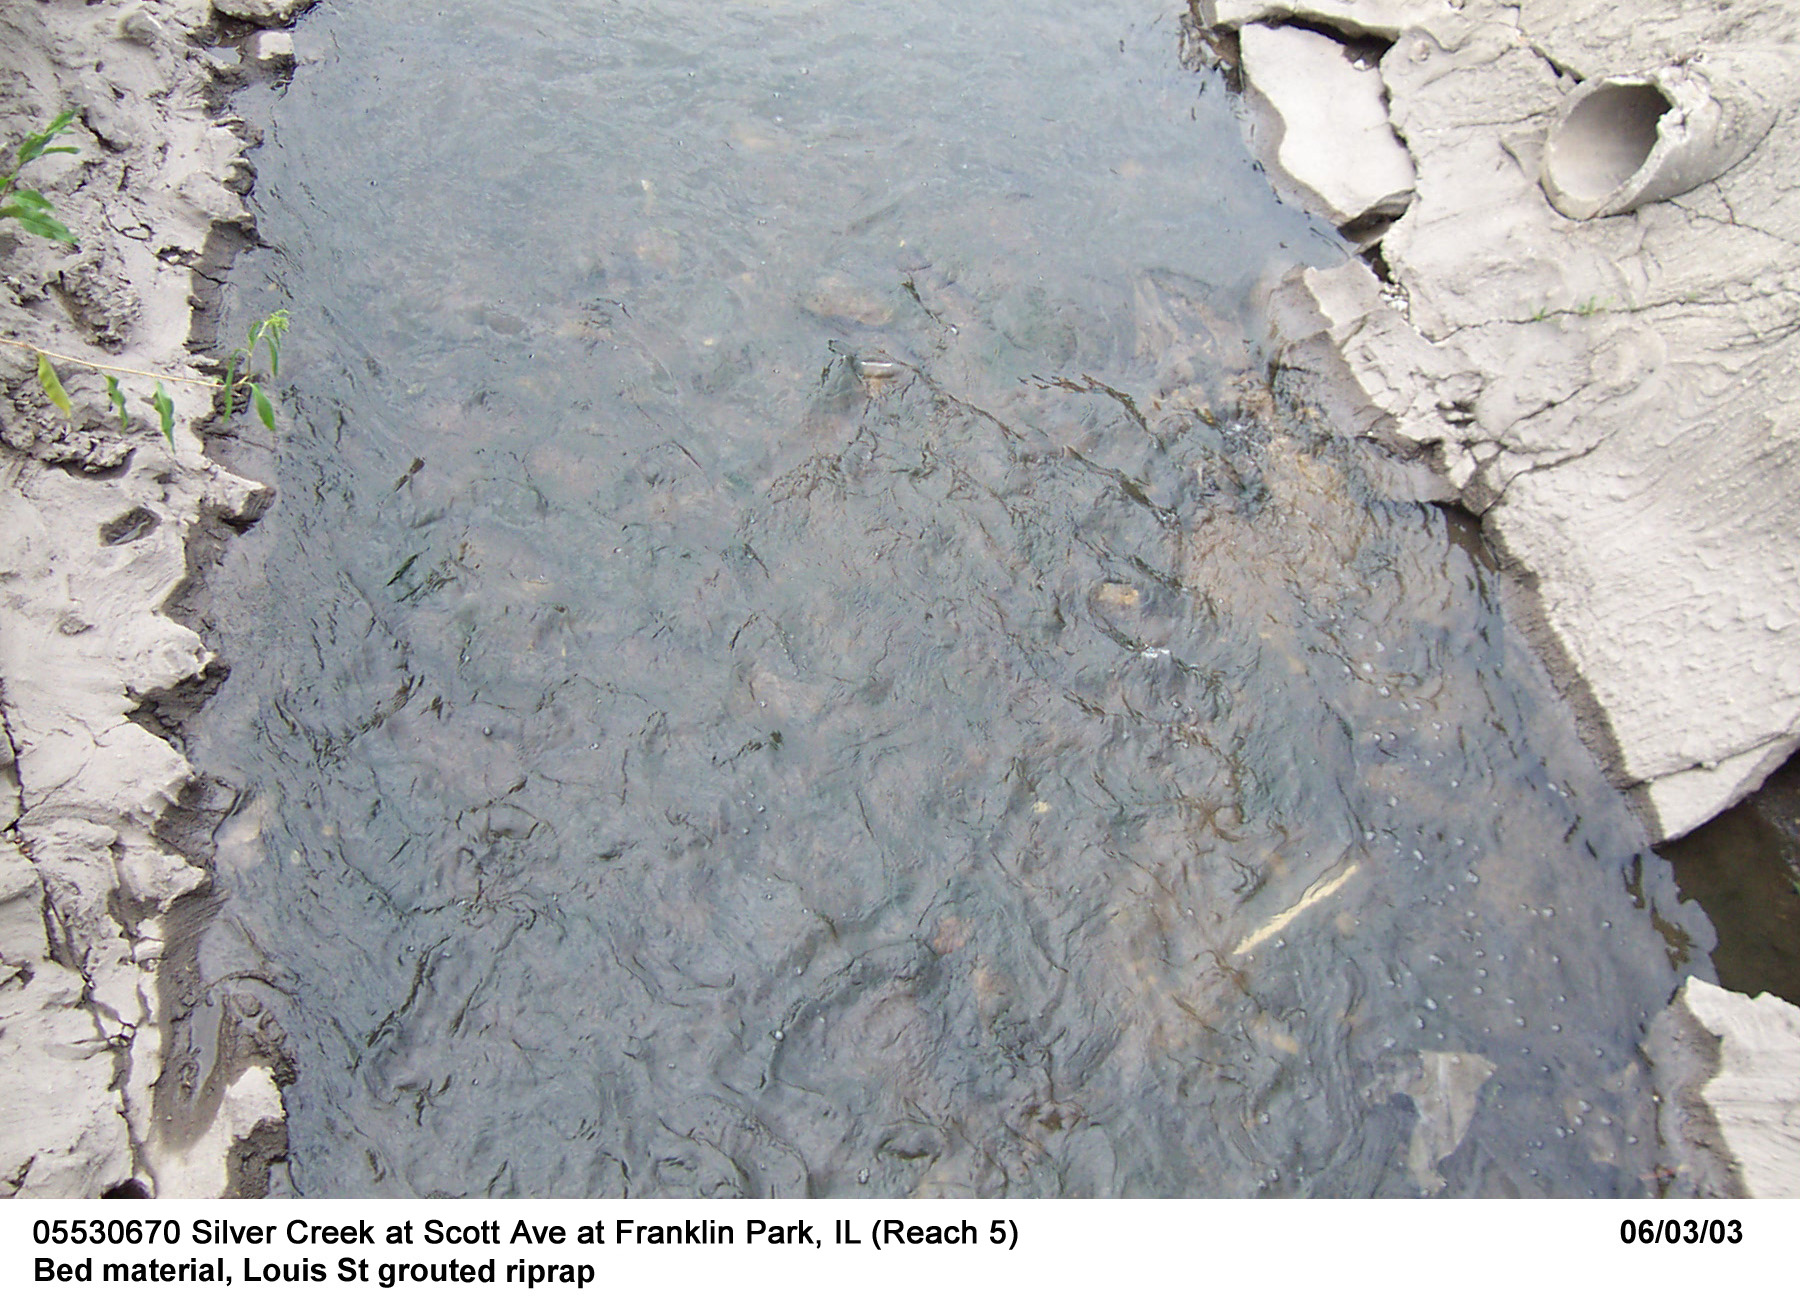
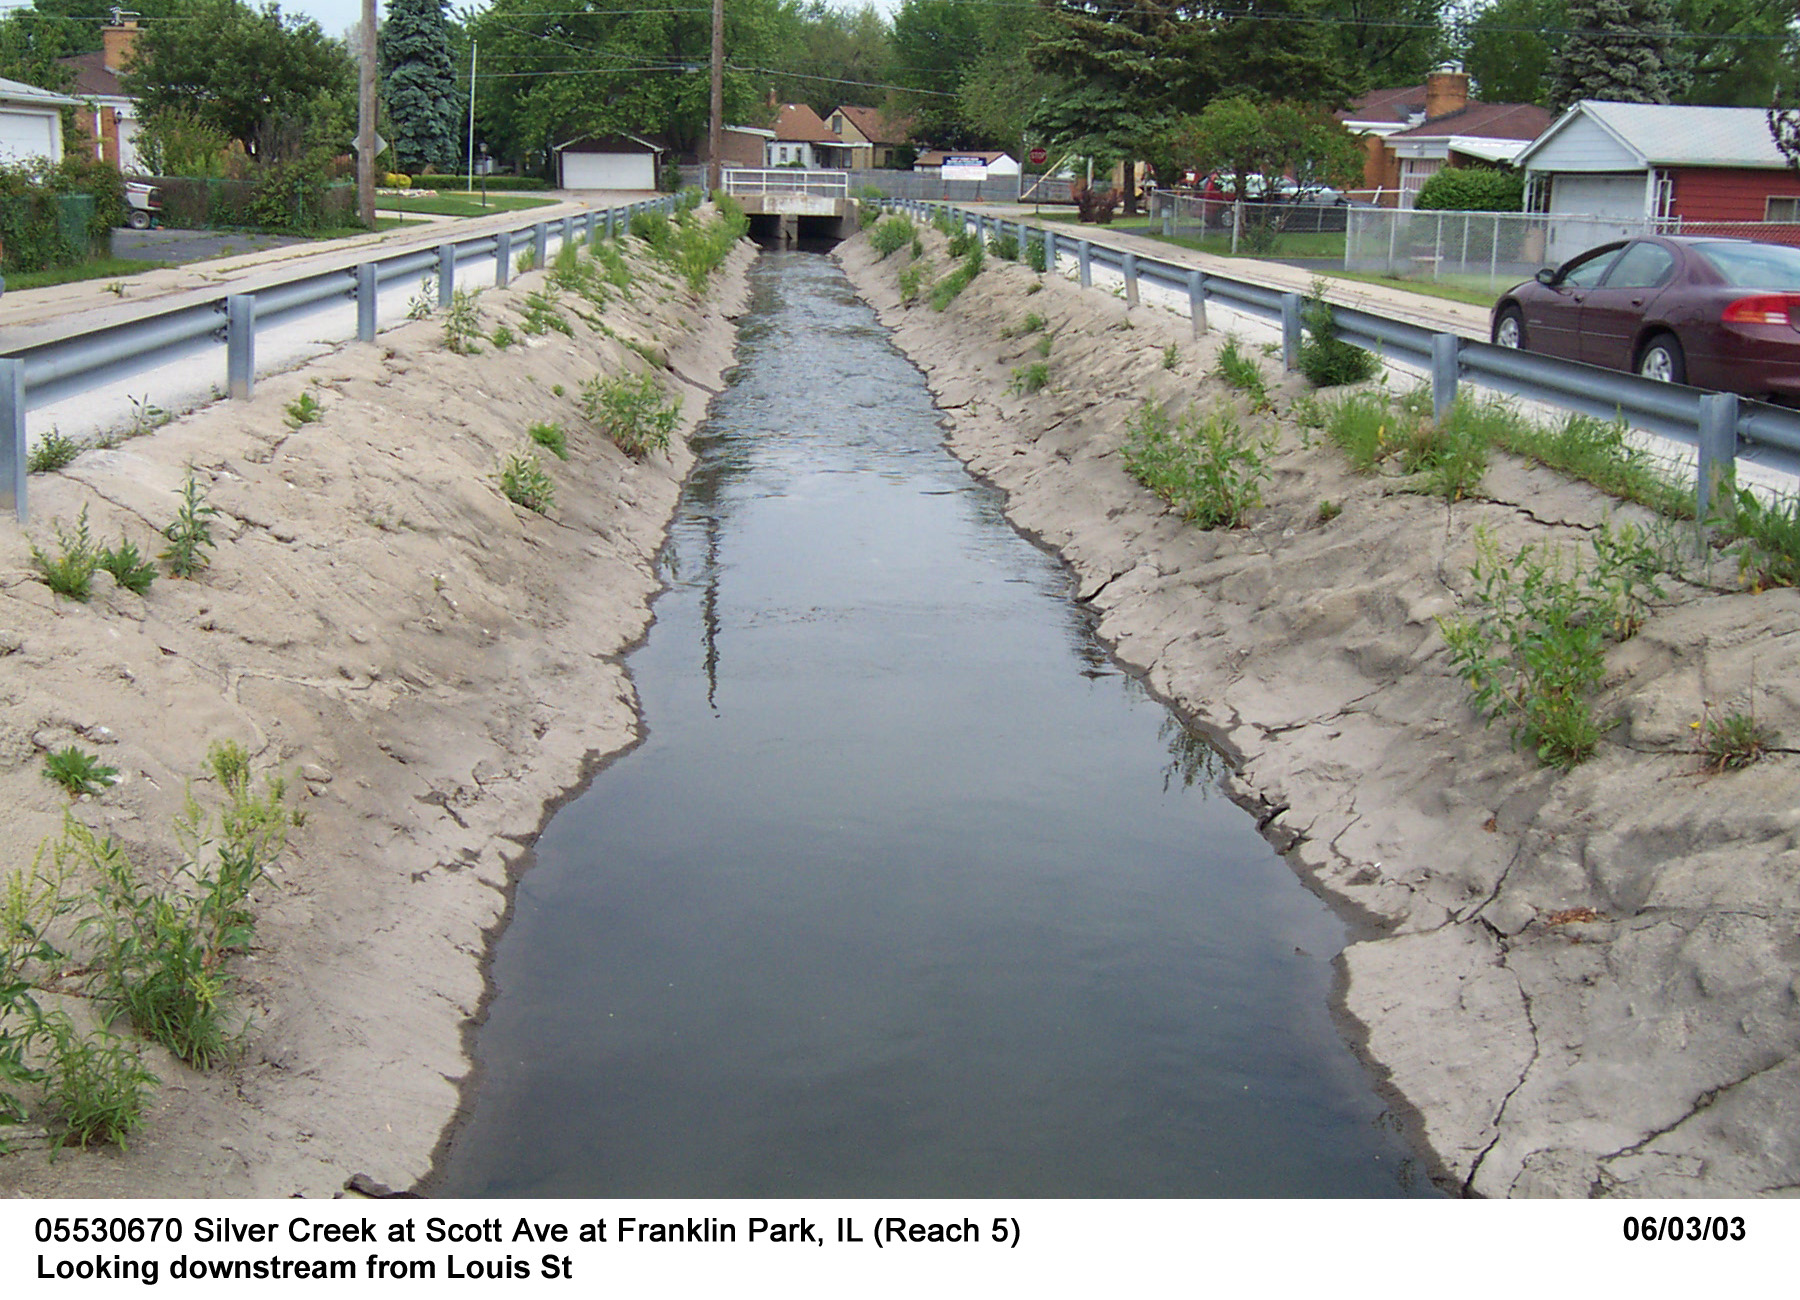
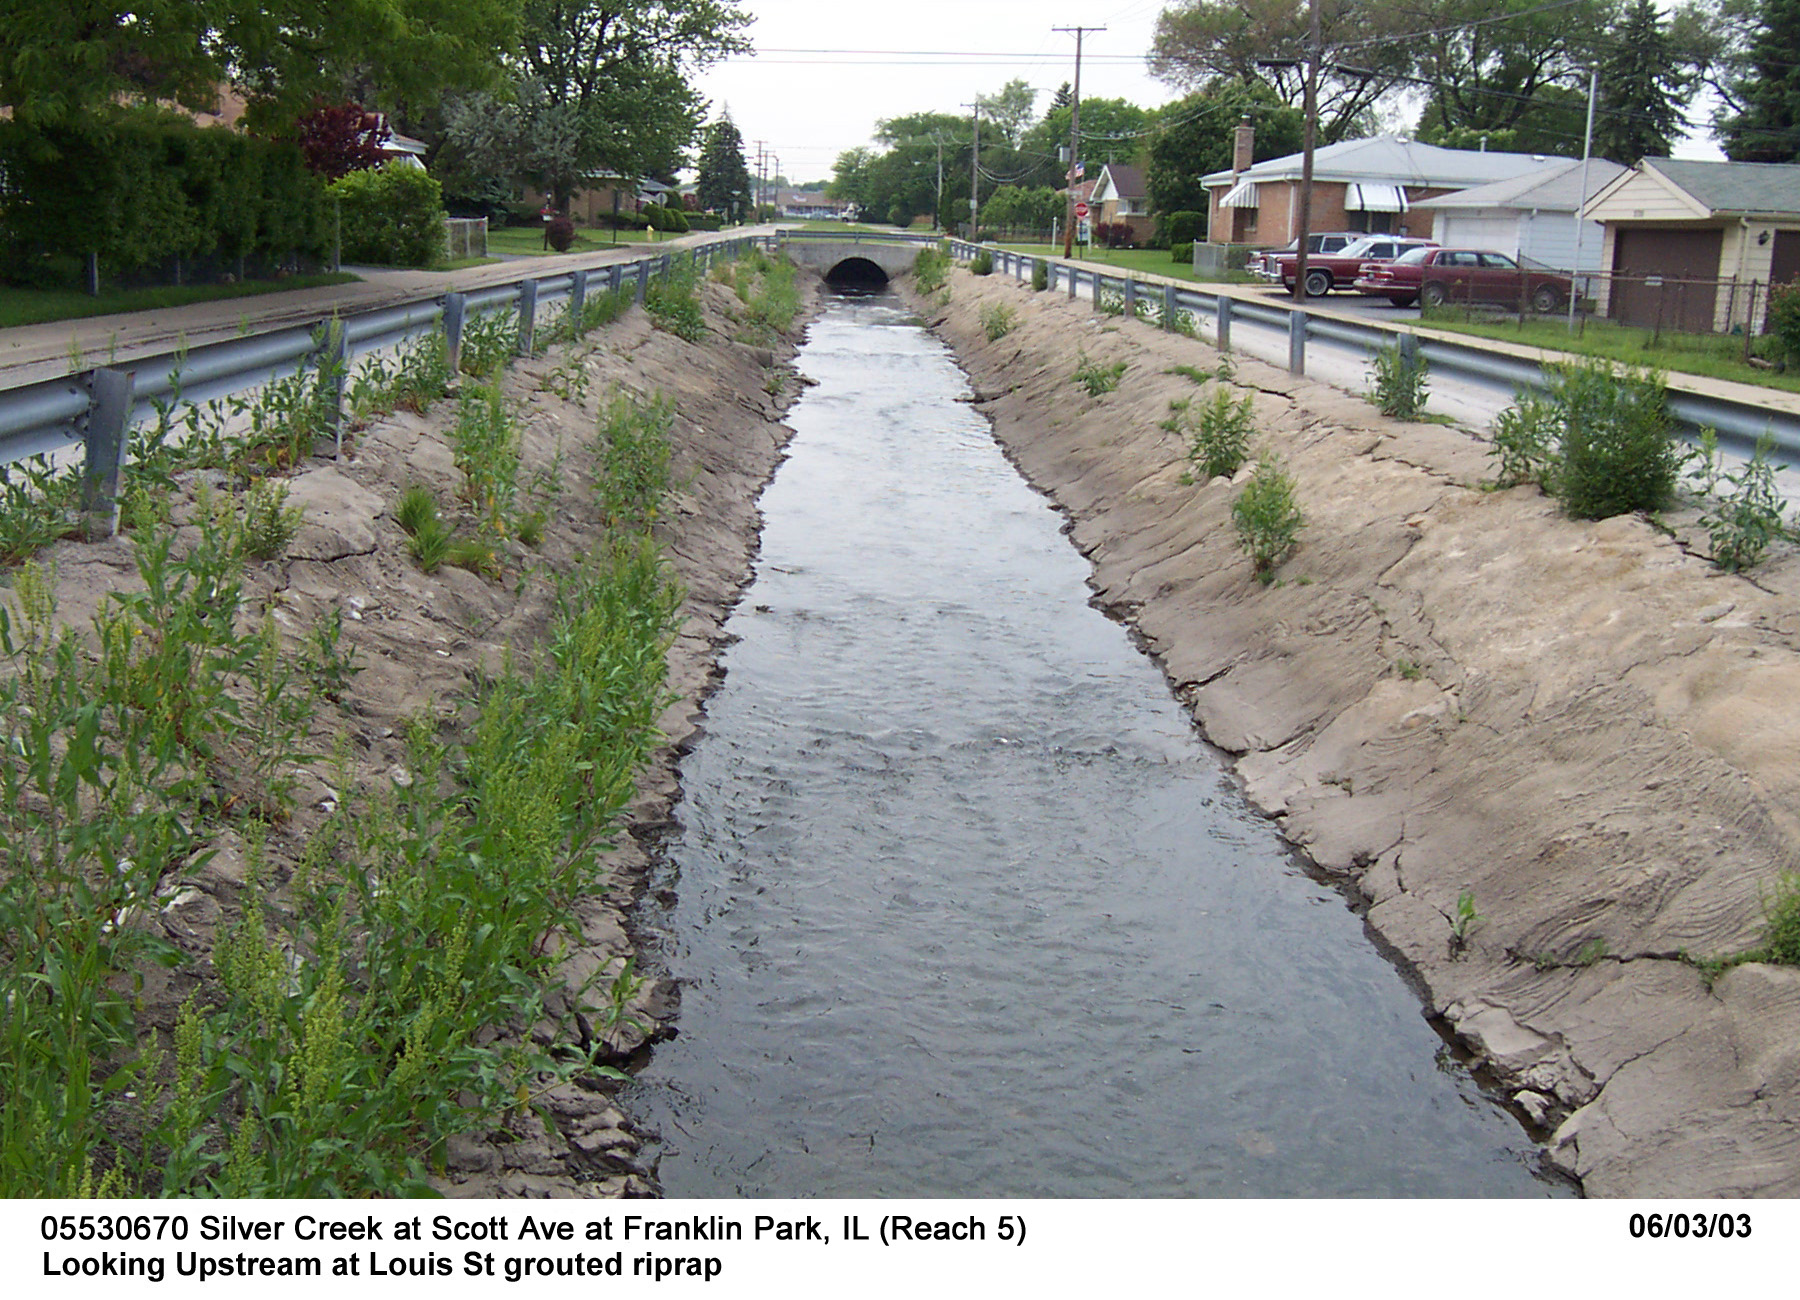
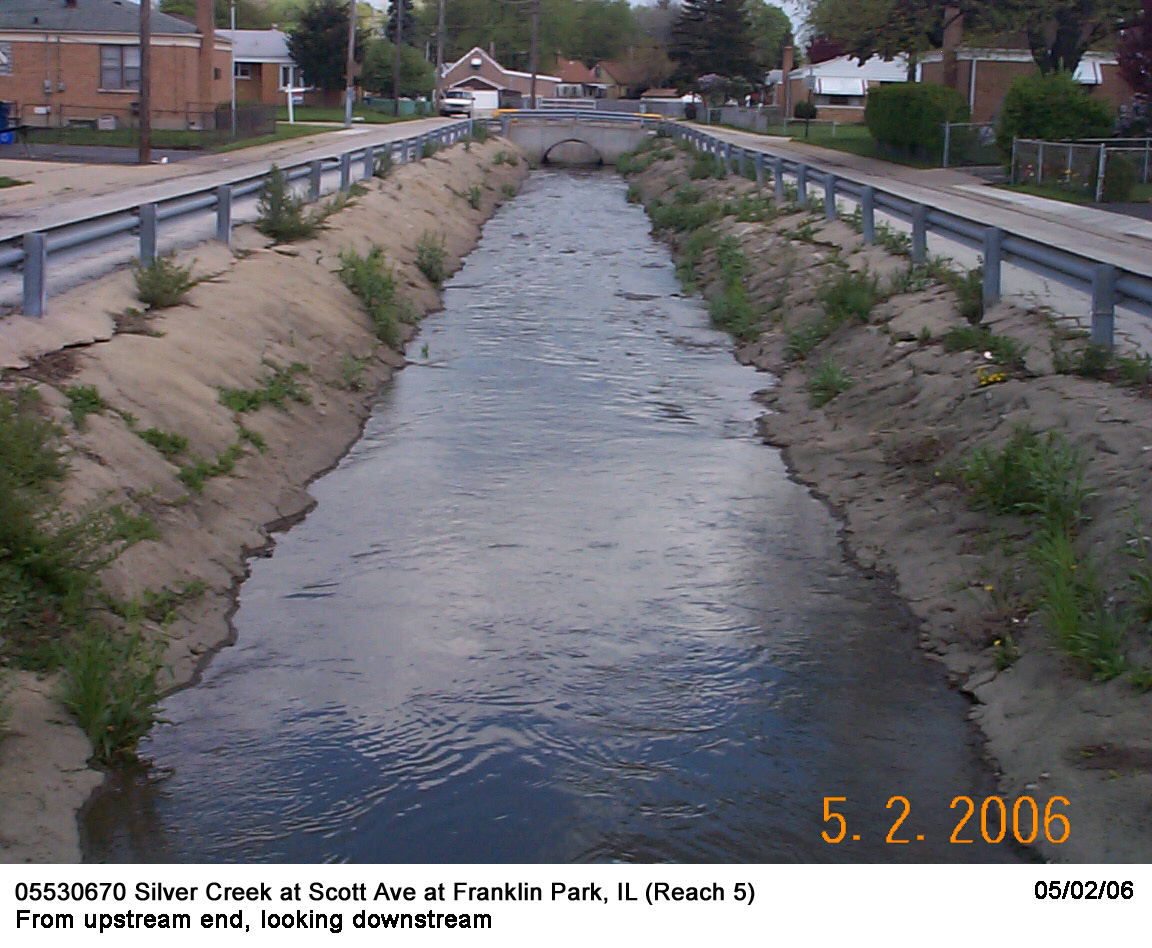
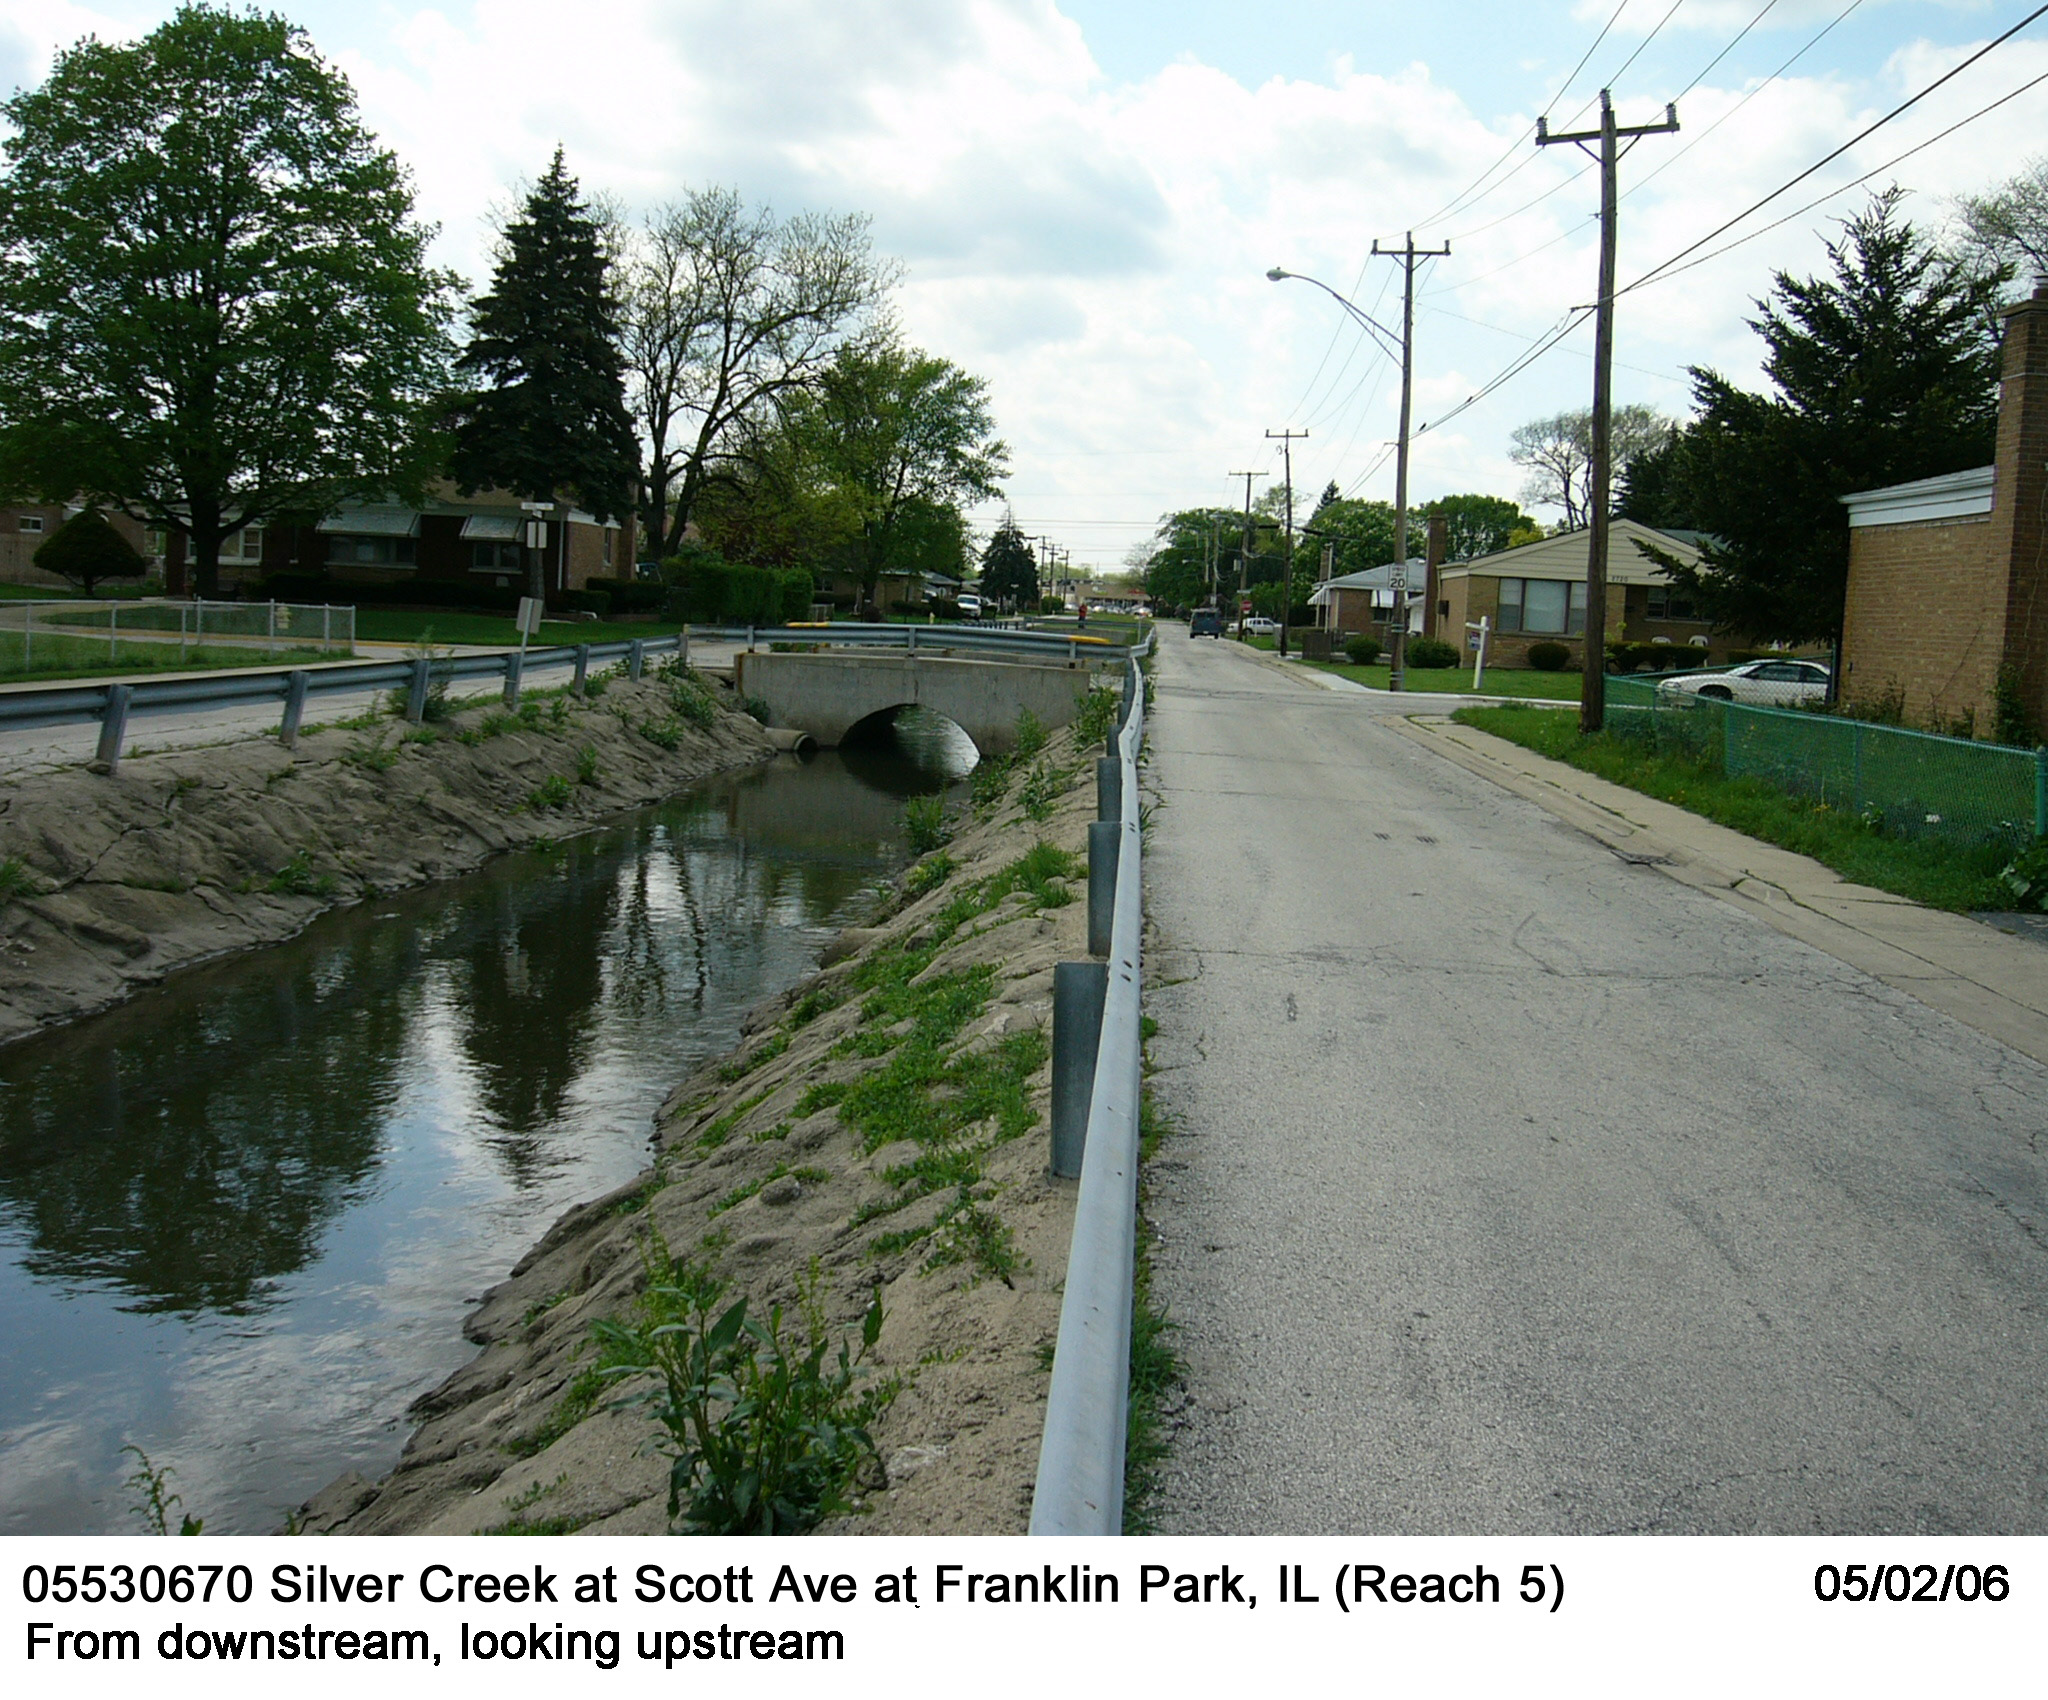
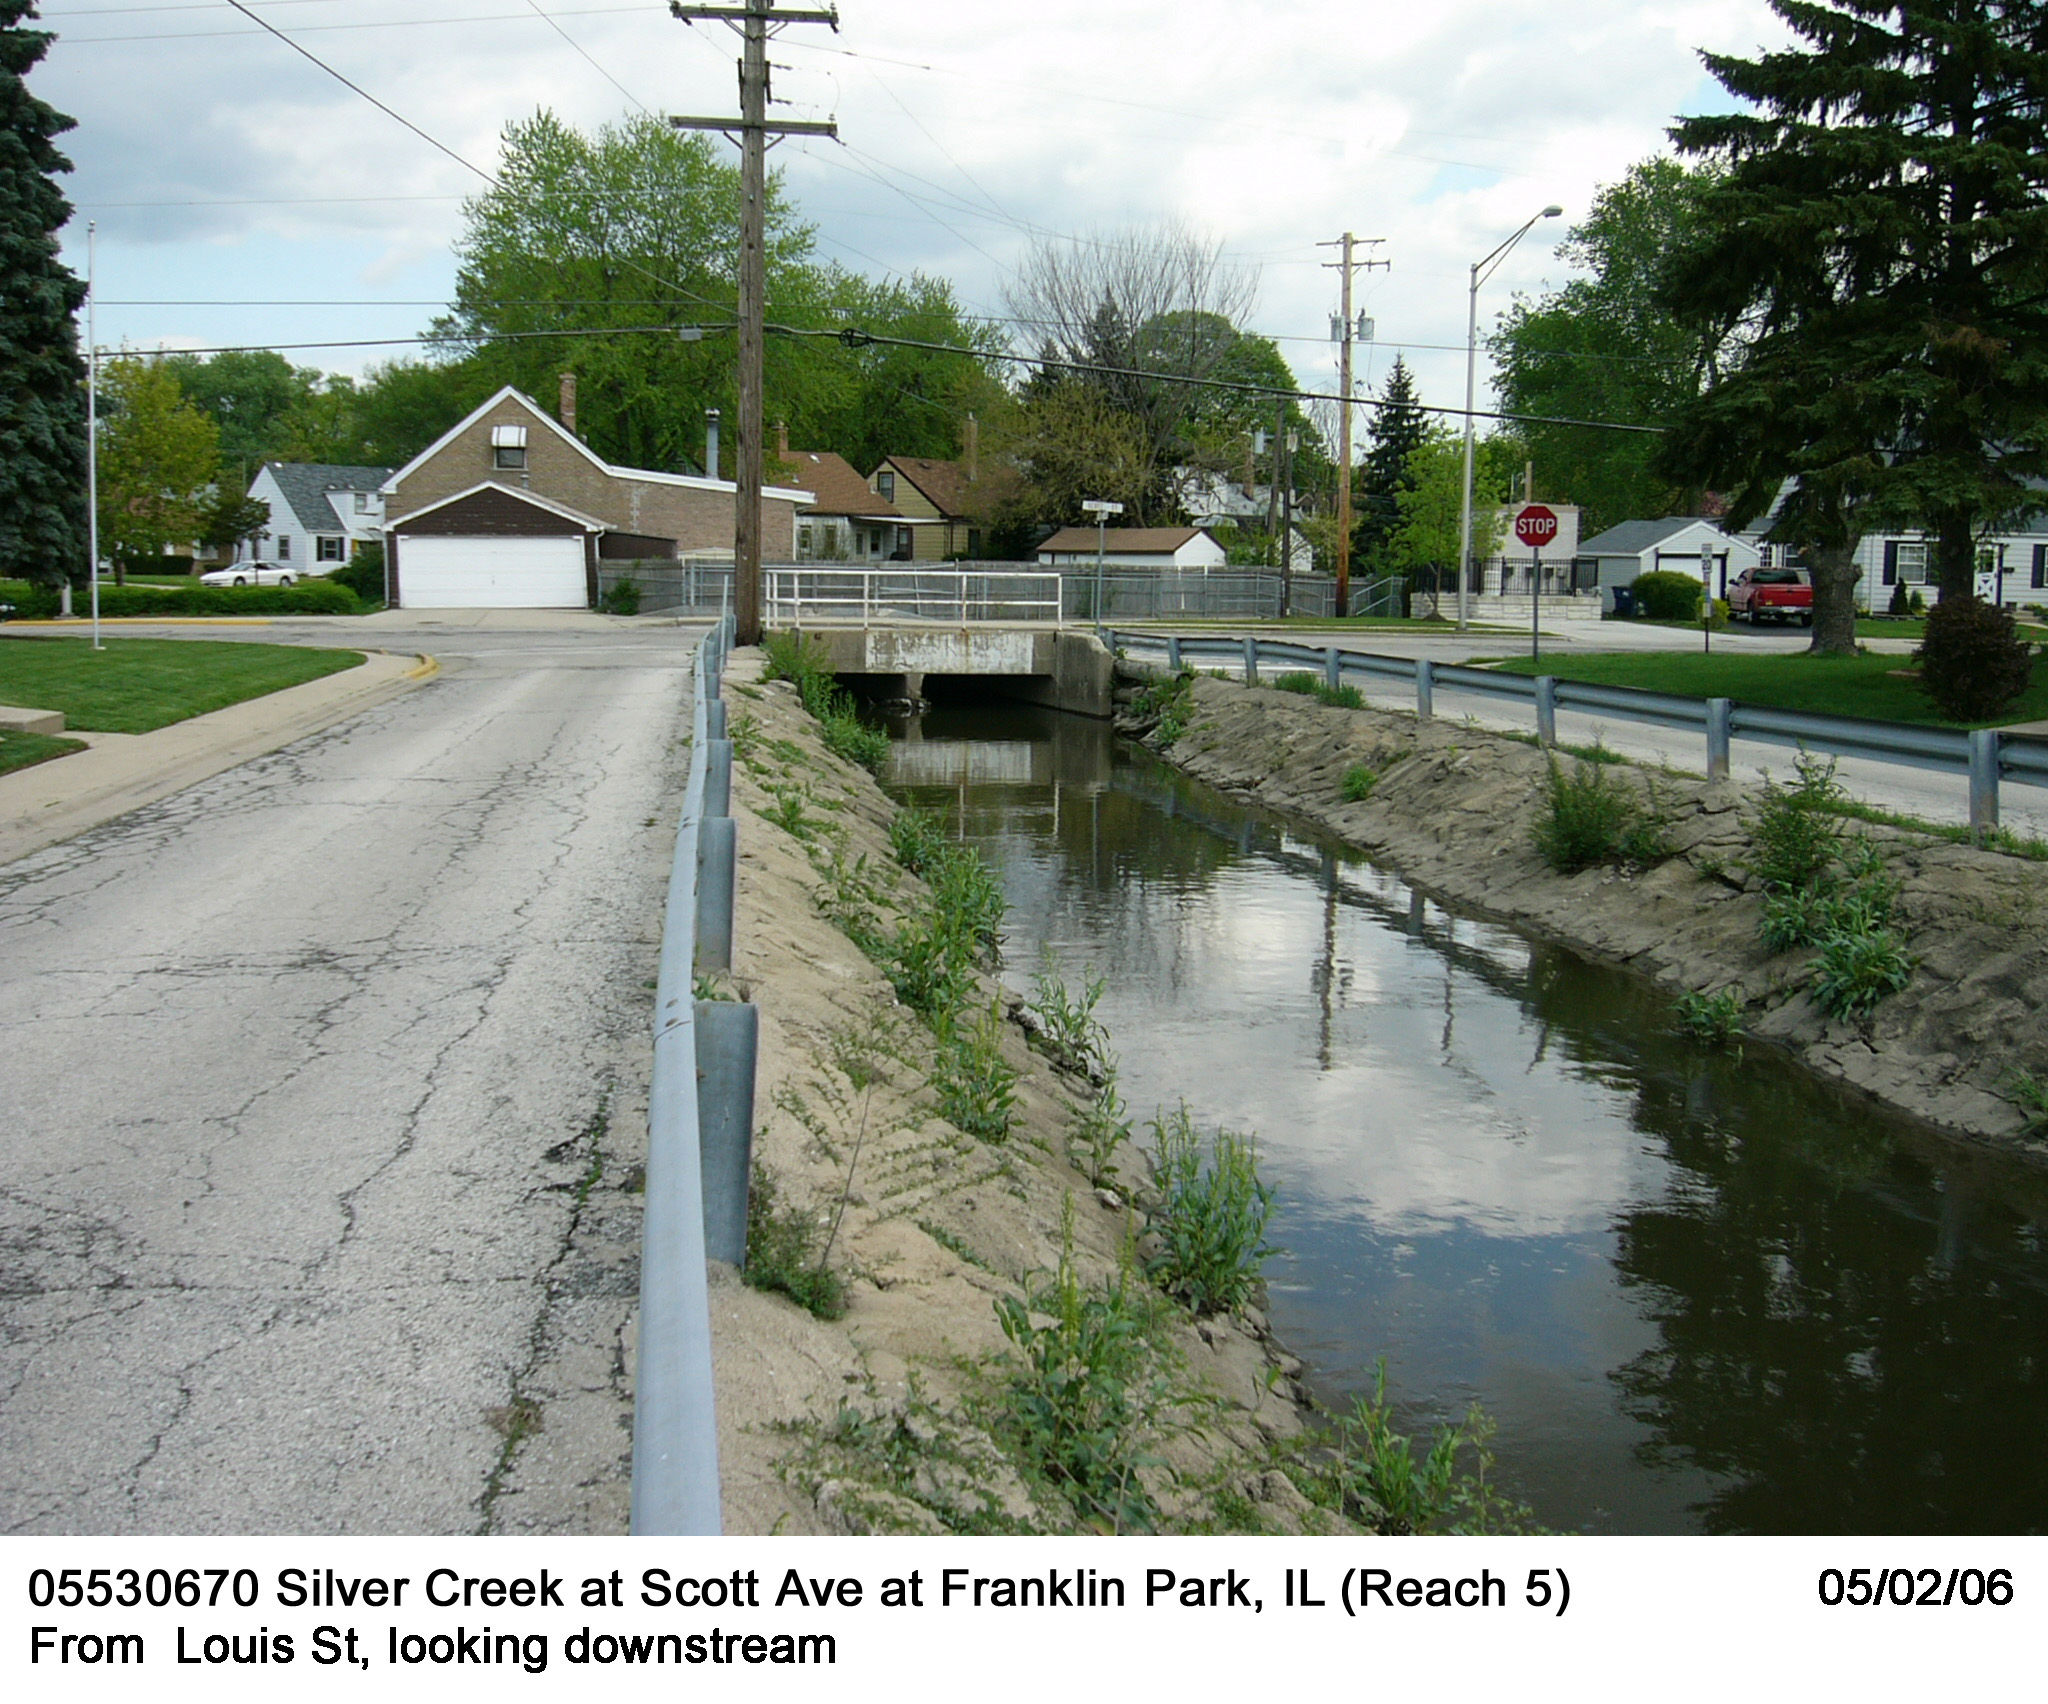
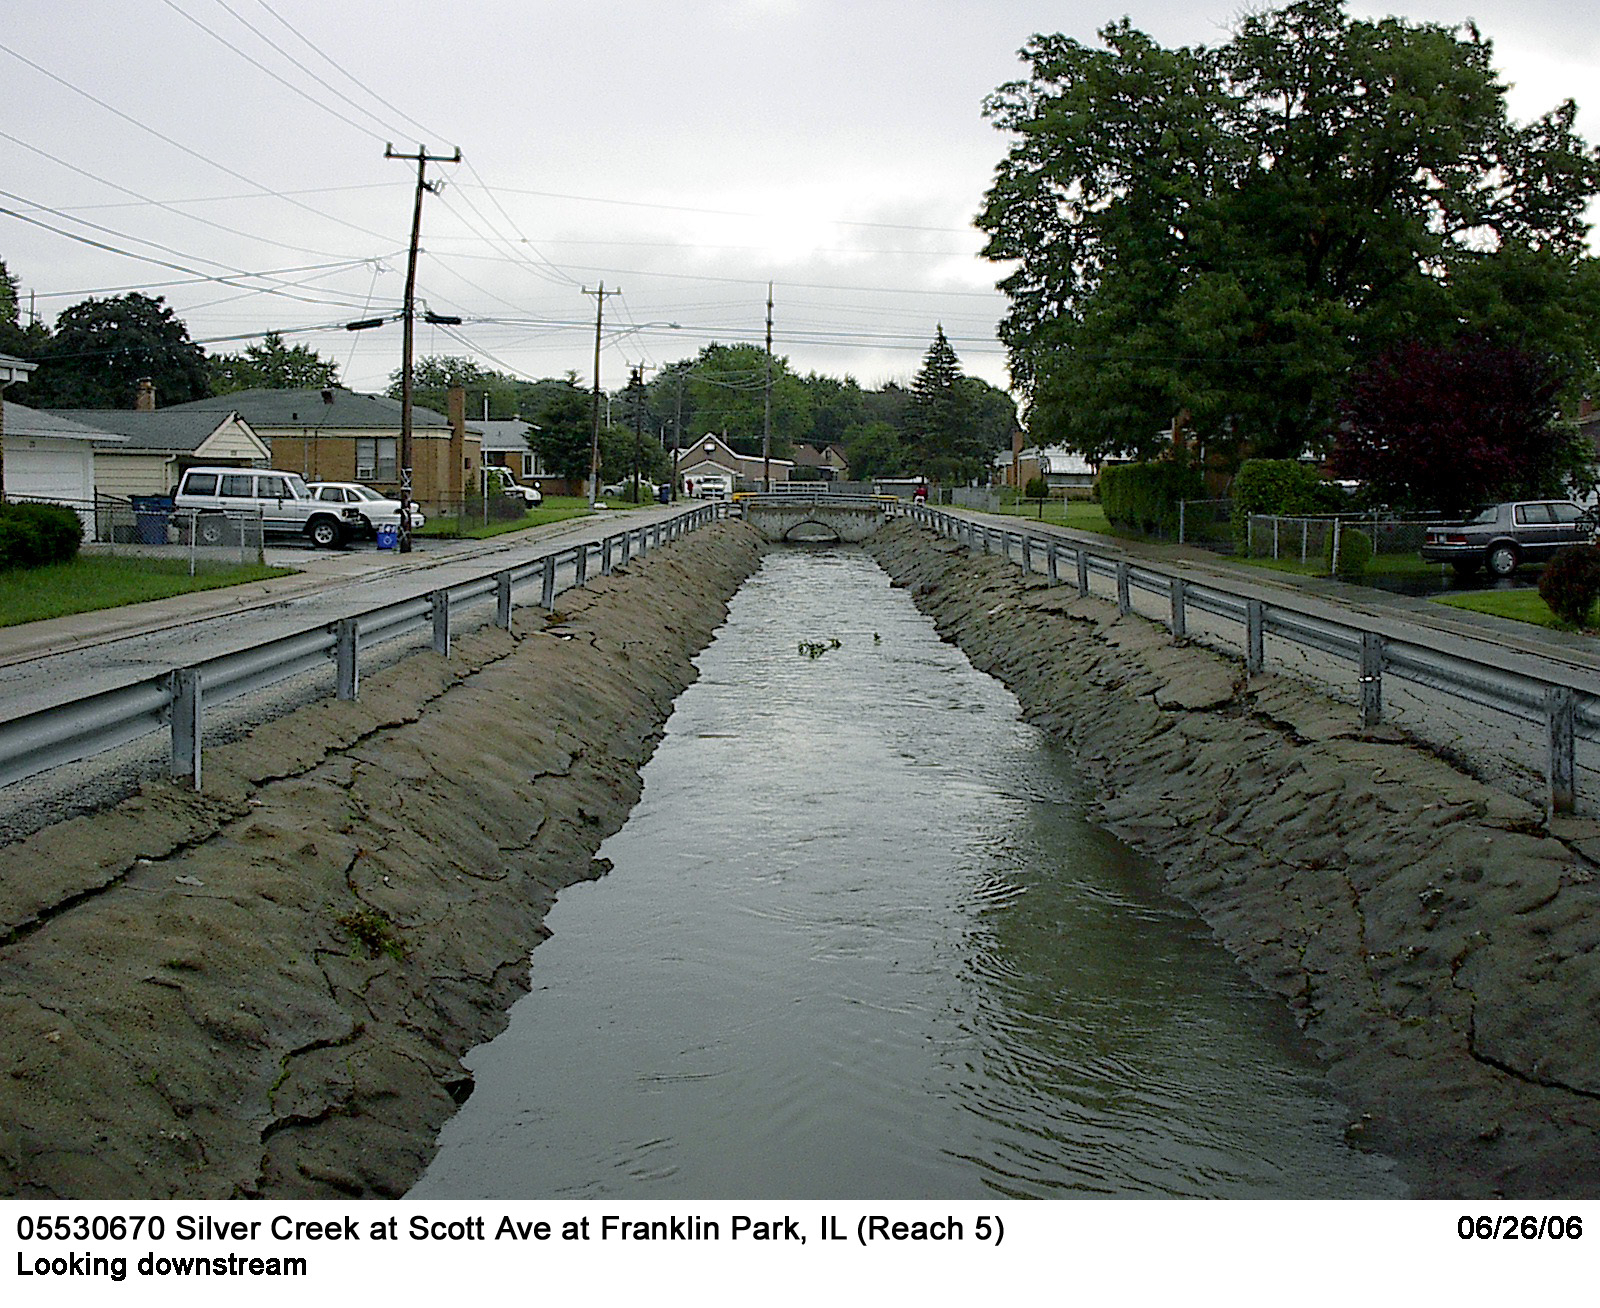
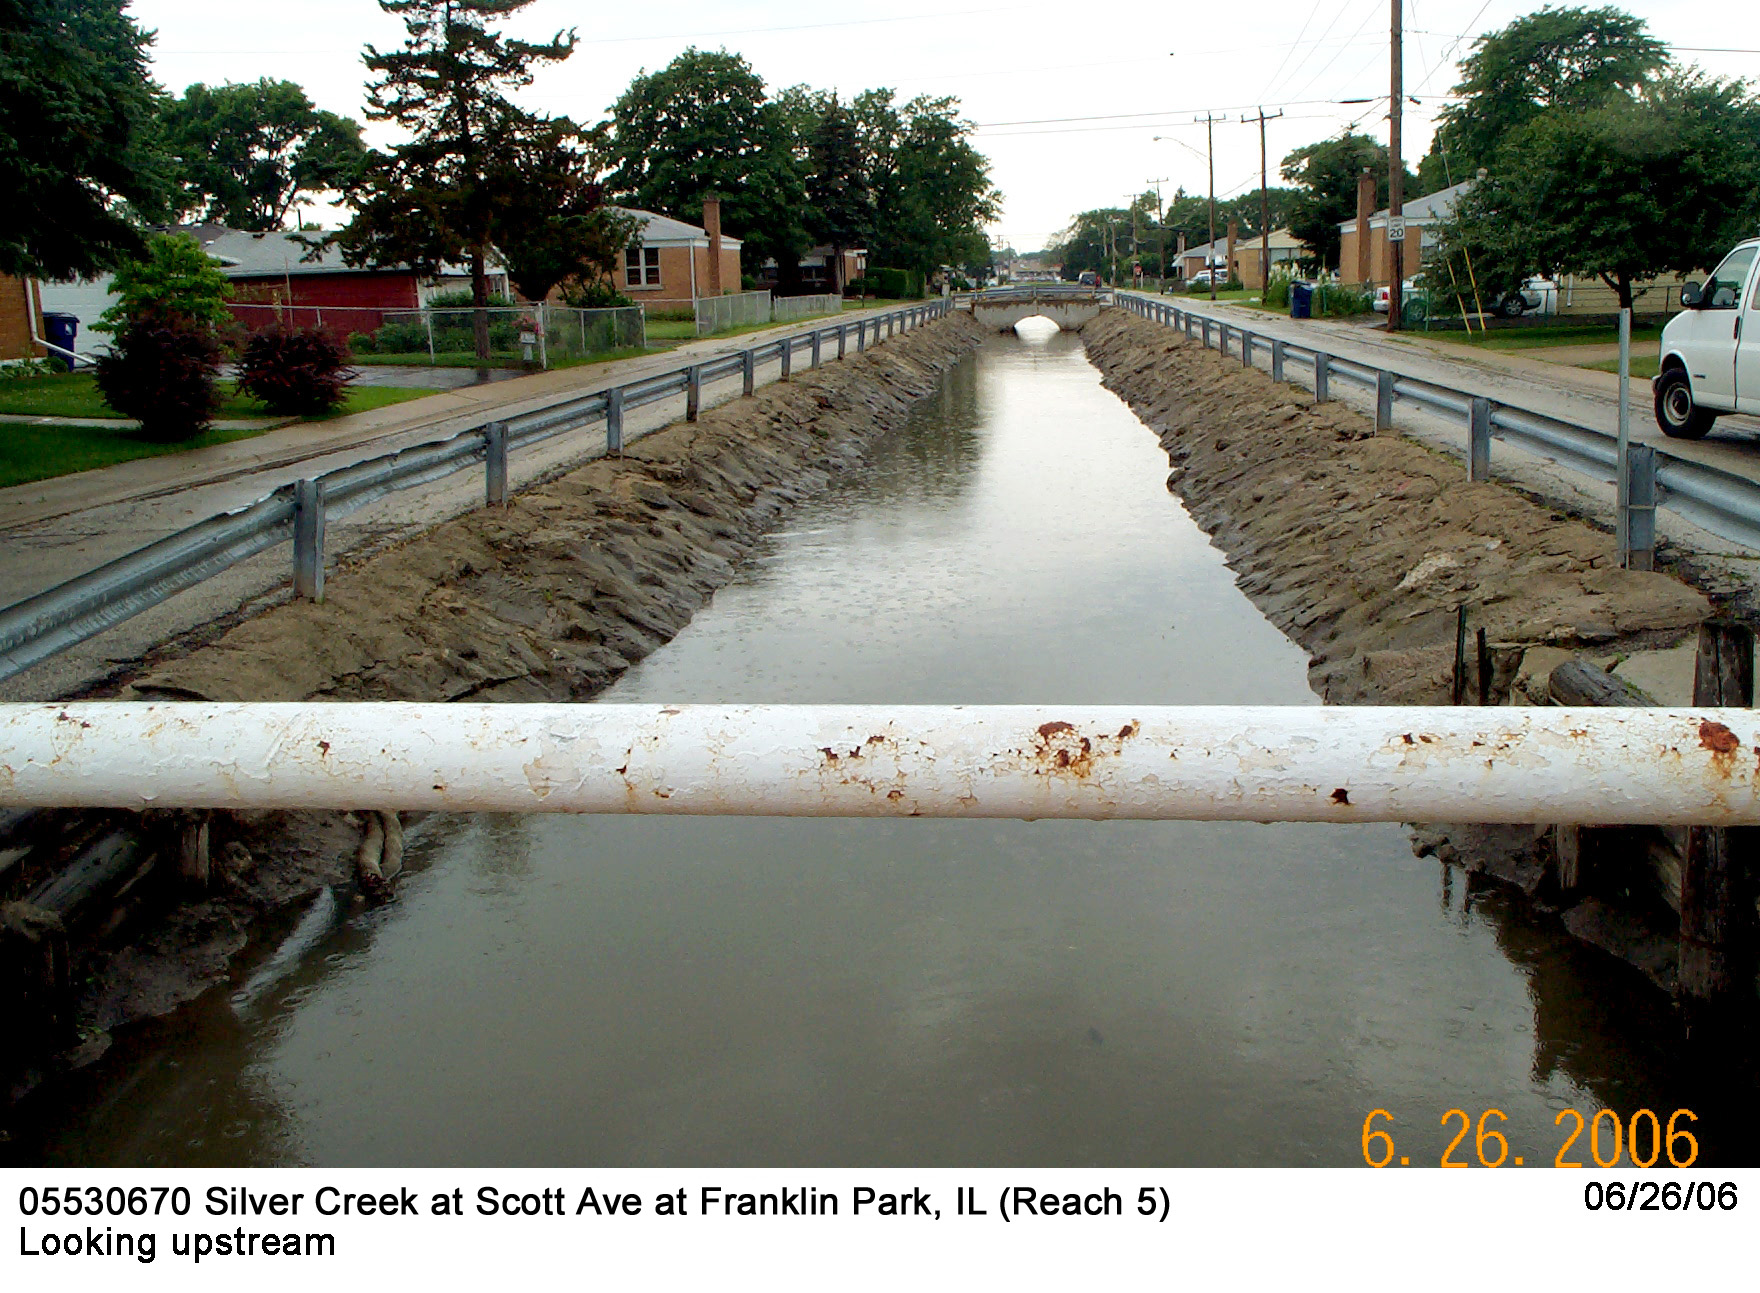
Description of Channel.--This channel is artificial with grouted riprap banks and bed. The channel bed has cobbles on top of sand and is subject to algae growth, especially during warm periods. Channel cross sections are trapezoidal in shape with a top width of about 30 ft. The grouted concrete banks are moderately steep and have large weeds growing in through the cracks.
Floods.--Maximum discharge, 15,500 ft3/s, Apr. 13, 1994, gage height, 20.46 ft.

![]() U.S. Department of the Interior |
U.S. Geological Survey
U.S. Department of the Interior |
U.S. Geological Survey
URL: http://il.water.usgs.gov/proj/nvalues/db/sites/05530670.shtml[an error occurred while processing this directive]?
Page Contact Information: David Soong
Page Last Modified: February 4, 2013
