

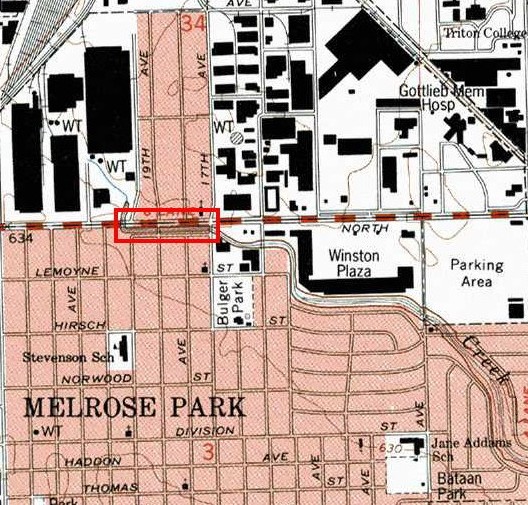
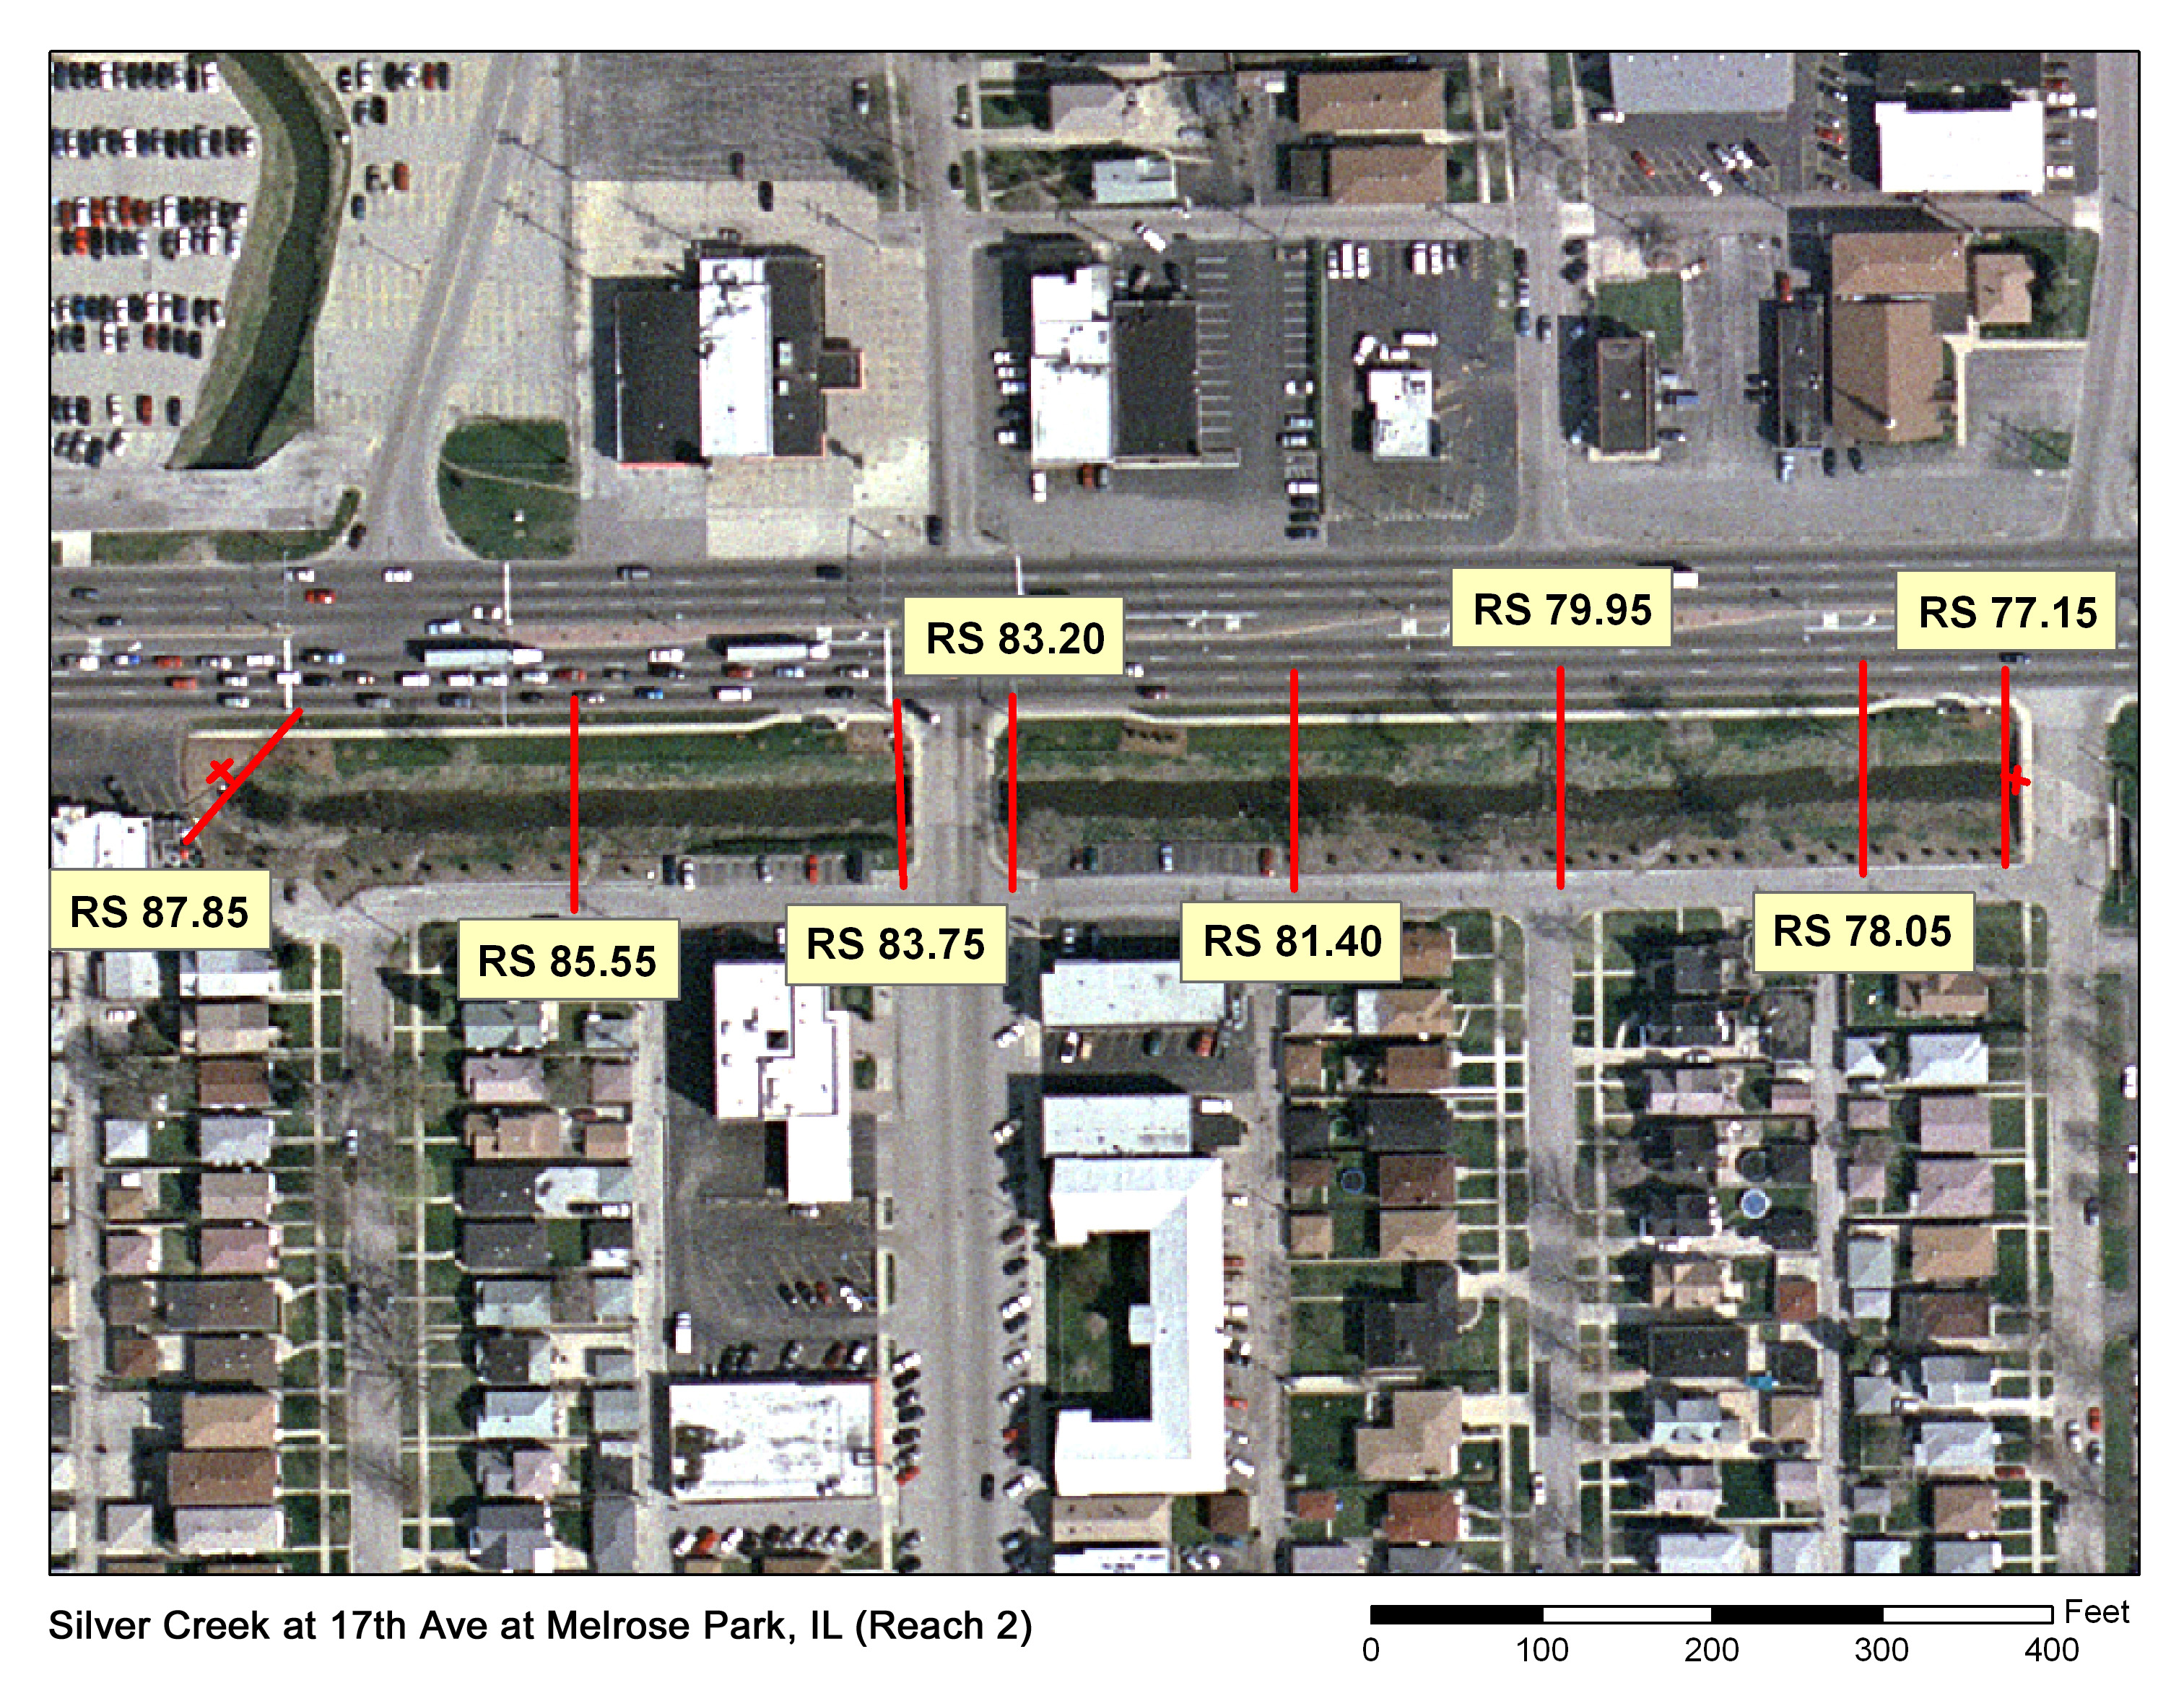
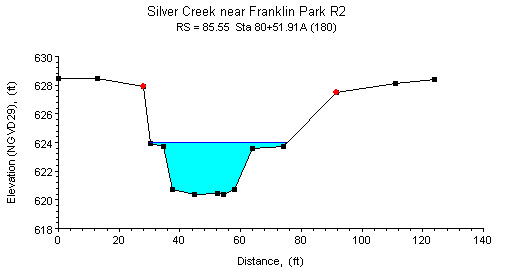
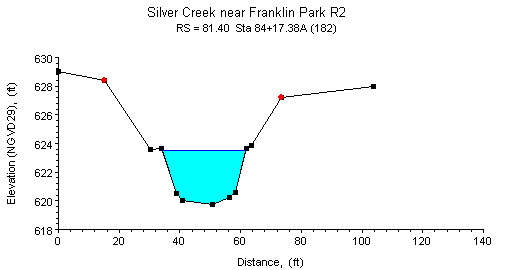
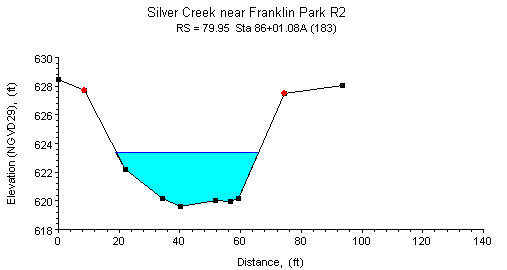
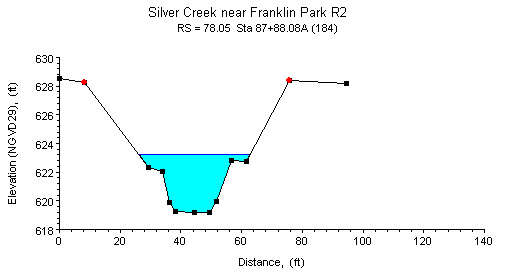
Study Reach.--The channel reach is a straight constructed channel in an urban area. The study reach is 1,070 ft long and is located downstream of the 20th Avenue (Jewel Drive) bridge and upstream of the 17th Avenue bridge, as shown in the quadrangle map on the top left. Eight surveyed cross sections (surveyed by the Illinois Department of Natural Resources in 1995) are available for evaluating the channel geometries of the study reach. The alignment of the study reach, approximate variations in channel width and bank conditions, and locations of surveyed cross sections are shown in the aerial photograph on the top right. The general channel shapes of the study reach are represented by four selected cross sections as plotted above.
Gage Location.--The location of discharge measurements is lat 41°54�27�, long 87°51�17�. The location of the study reach is at NW1/4 NW1/4 NE1/4 sec.3, T.39N, R.12E, Cook County, Hydrologic Unit 07120004. The USGS streamgage station number is 05530690.
Drainage Area.--10.64 sq mi. (at downstream end of study reach)
Gage Datum and Elevations of Reference Points.--The upstream reference point (RP-N4) is two file marks on the 9th I-beam from the right located on the downstream face of the North Avenue bridge, elevation=631.06 ft. The downstream reference point (RP-N3) is the top of a bolt located on the upstream face of the 17th Avenue bridge, elevation 631.21 ft. All elevations are referenced to NGVD29.
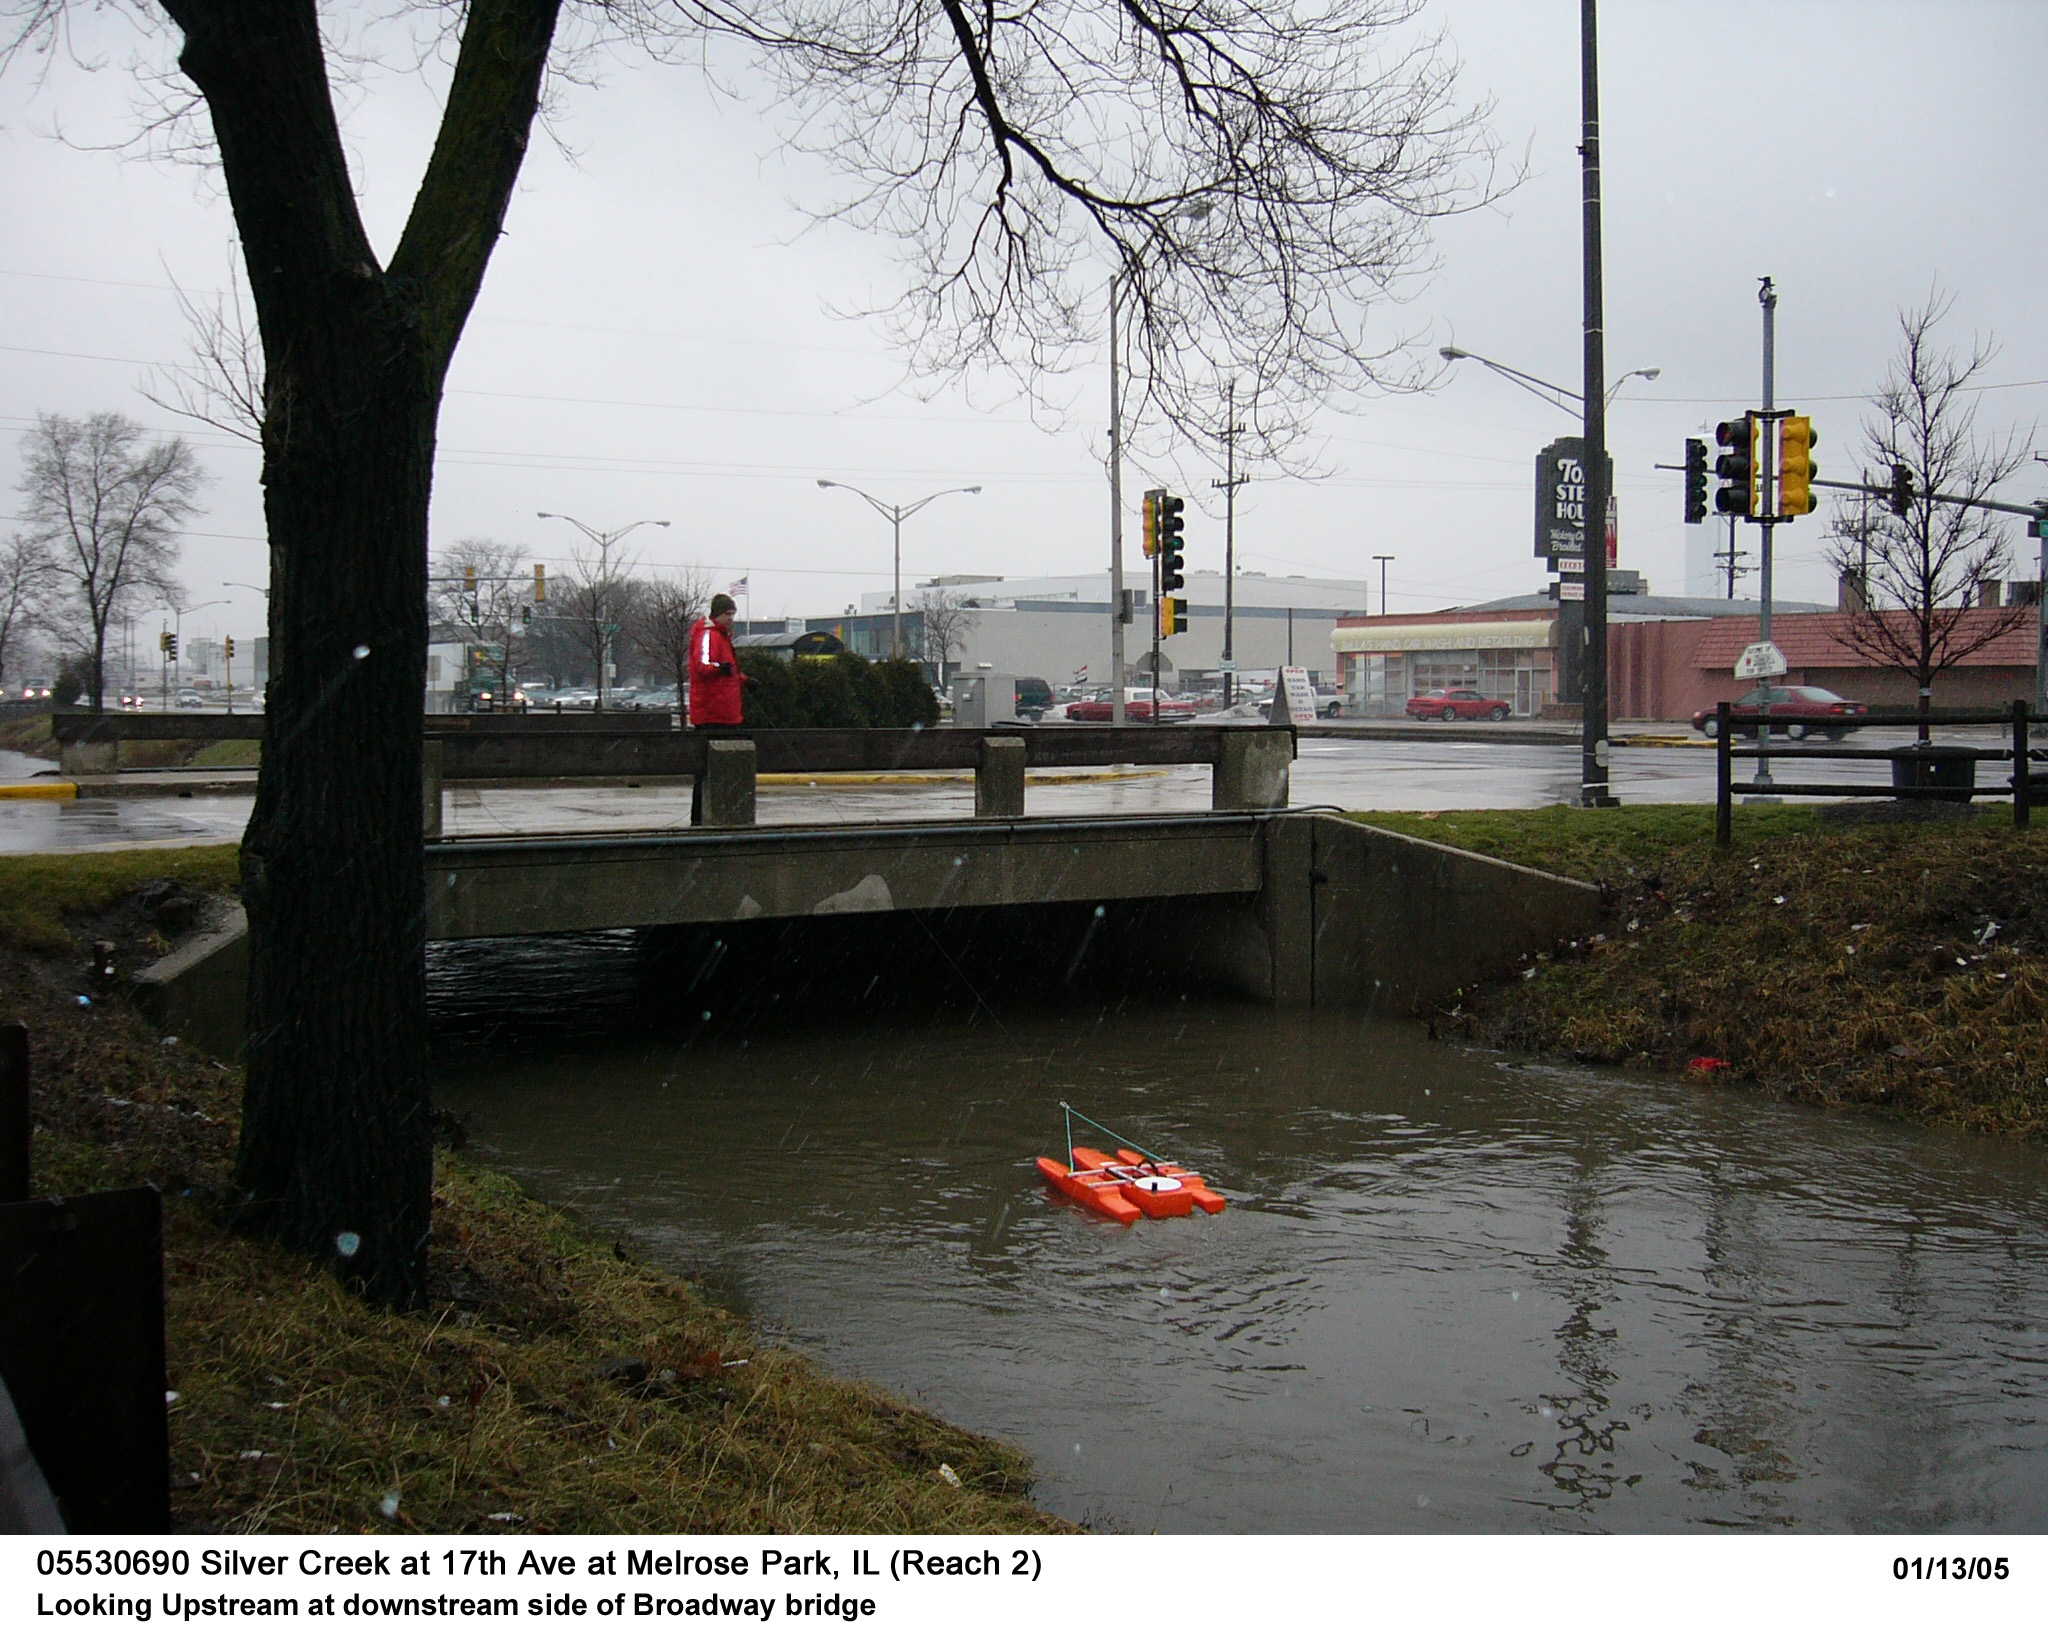
Stage, Discharge Measurements and Computed n-Values.--Water-surface elevations are measured by tape down from the upstream and downstream reference points before, during and after each discharge measurement. Discharges are measured from the downstream side of Broadway Avenue or from the upstream side of the 17th Avenue bridge. Discharge measurements are made using an Acoustic Doppler Current Profiler (ADCP) or using the conventional current-meter method. The computed n-values are listed in the following table. Whenever possible, the computed n-values are associated with a photograph taken at the time of the measurement. The photographs are arranged from low to high discharge in order to illustrate the contributing factors of n-values at a particular discharge.
| Date of Observation | Discharge (ft3/s) | Average Cross Section Area (ft2) | Hydraulic Radius (ft) | Mean Velocity (ft/s) | Slope (ft/ft) | Coefficient of Roughness n |
|---|---|---|---|---|---|---|
| 5/2/2006 | 24.9 | 39.6 | 1.48 | 0.65 | 0.002172 | 0.144 |
| 6/26/2006 | 39.0 | 47.7 | 1.71 | 0.85 | 0.001890 | 0.112 |
| 4/25/2007 | 112.0 | 59.1 | 1.95 | 1.99 | 0.001435 | 0.046 |
| 4/25/2007 | 116.0 | 59.9 | 1.96 | 2.03 | 0.001428 | 0.046 |
| 1/13/2005 | 176.0 | 90.0 | 2.53 | 2.05 | 0.001224 | 0.047 |
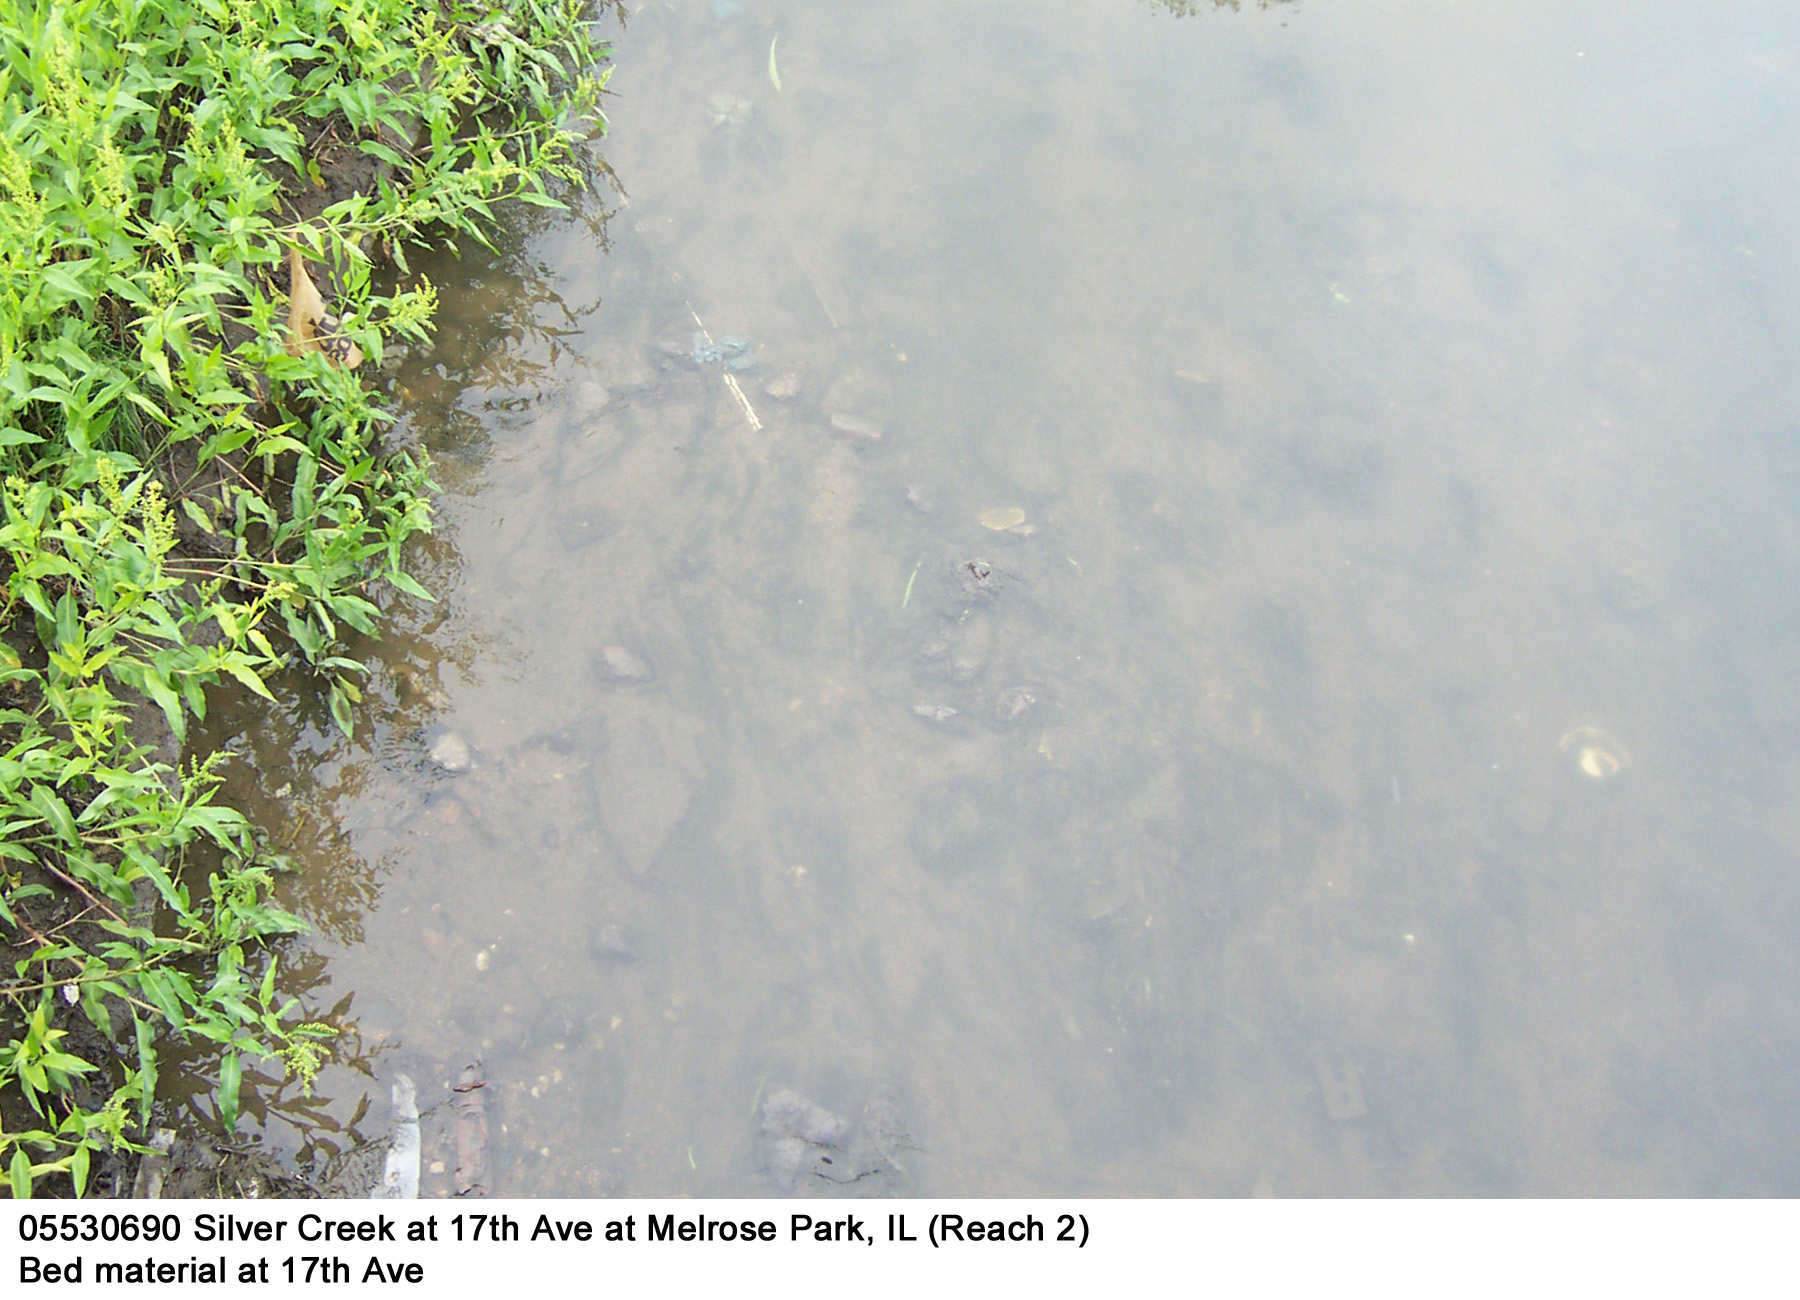
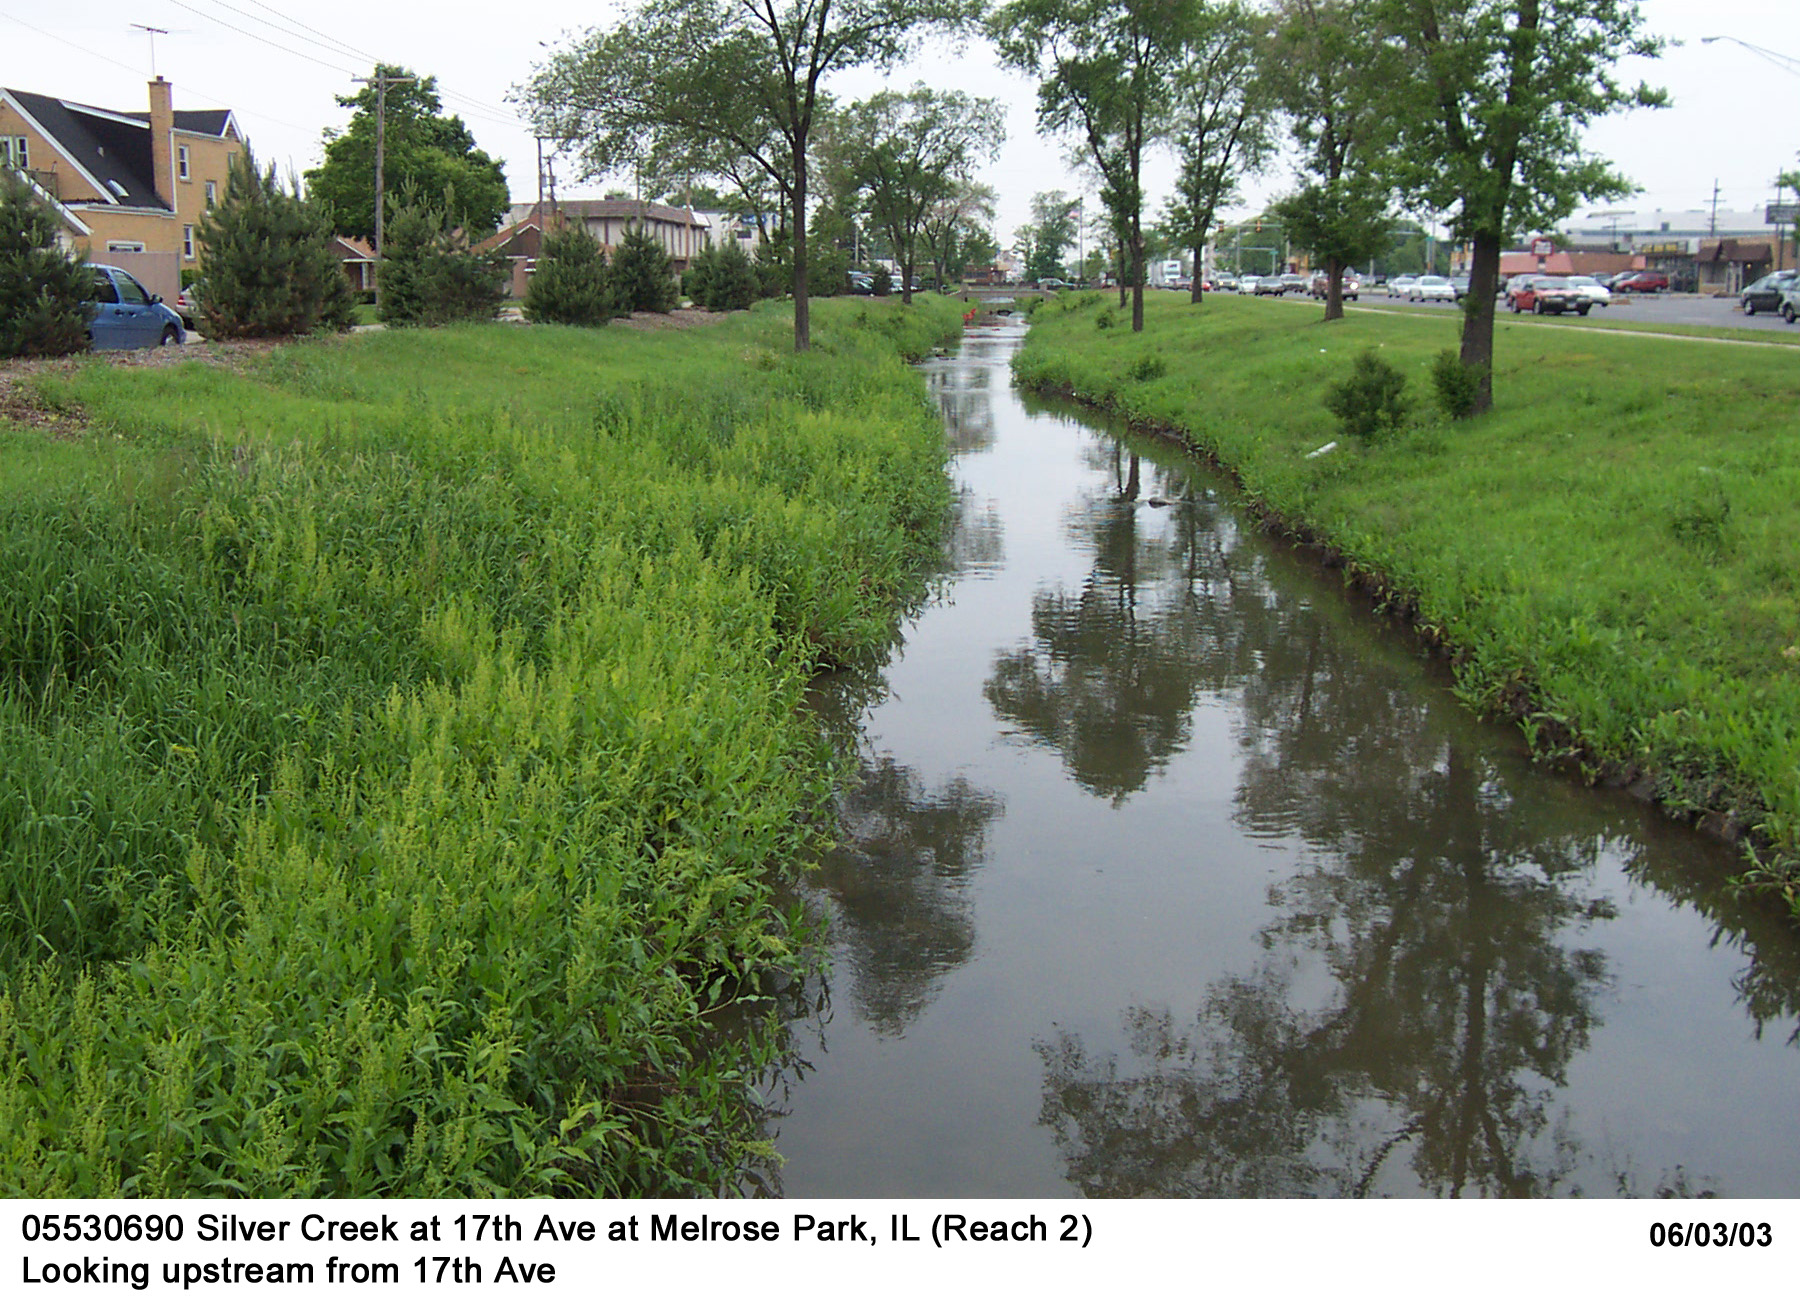
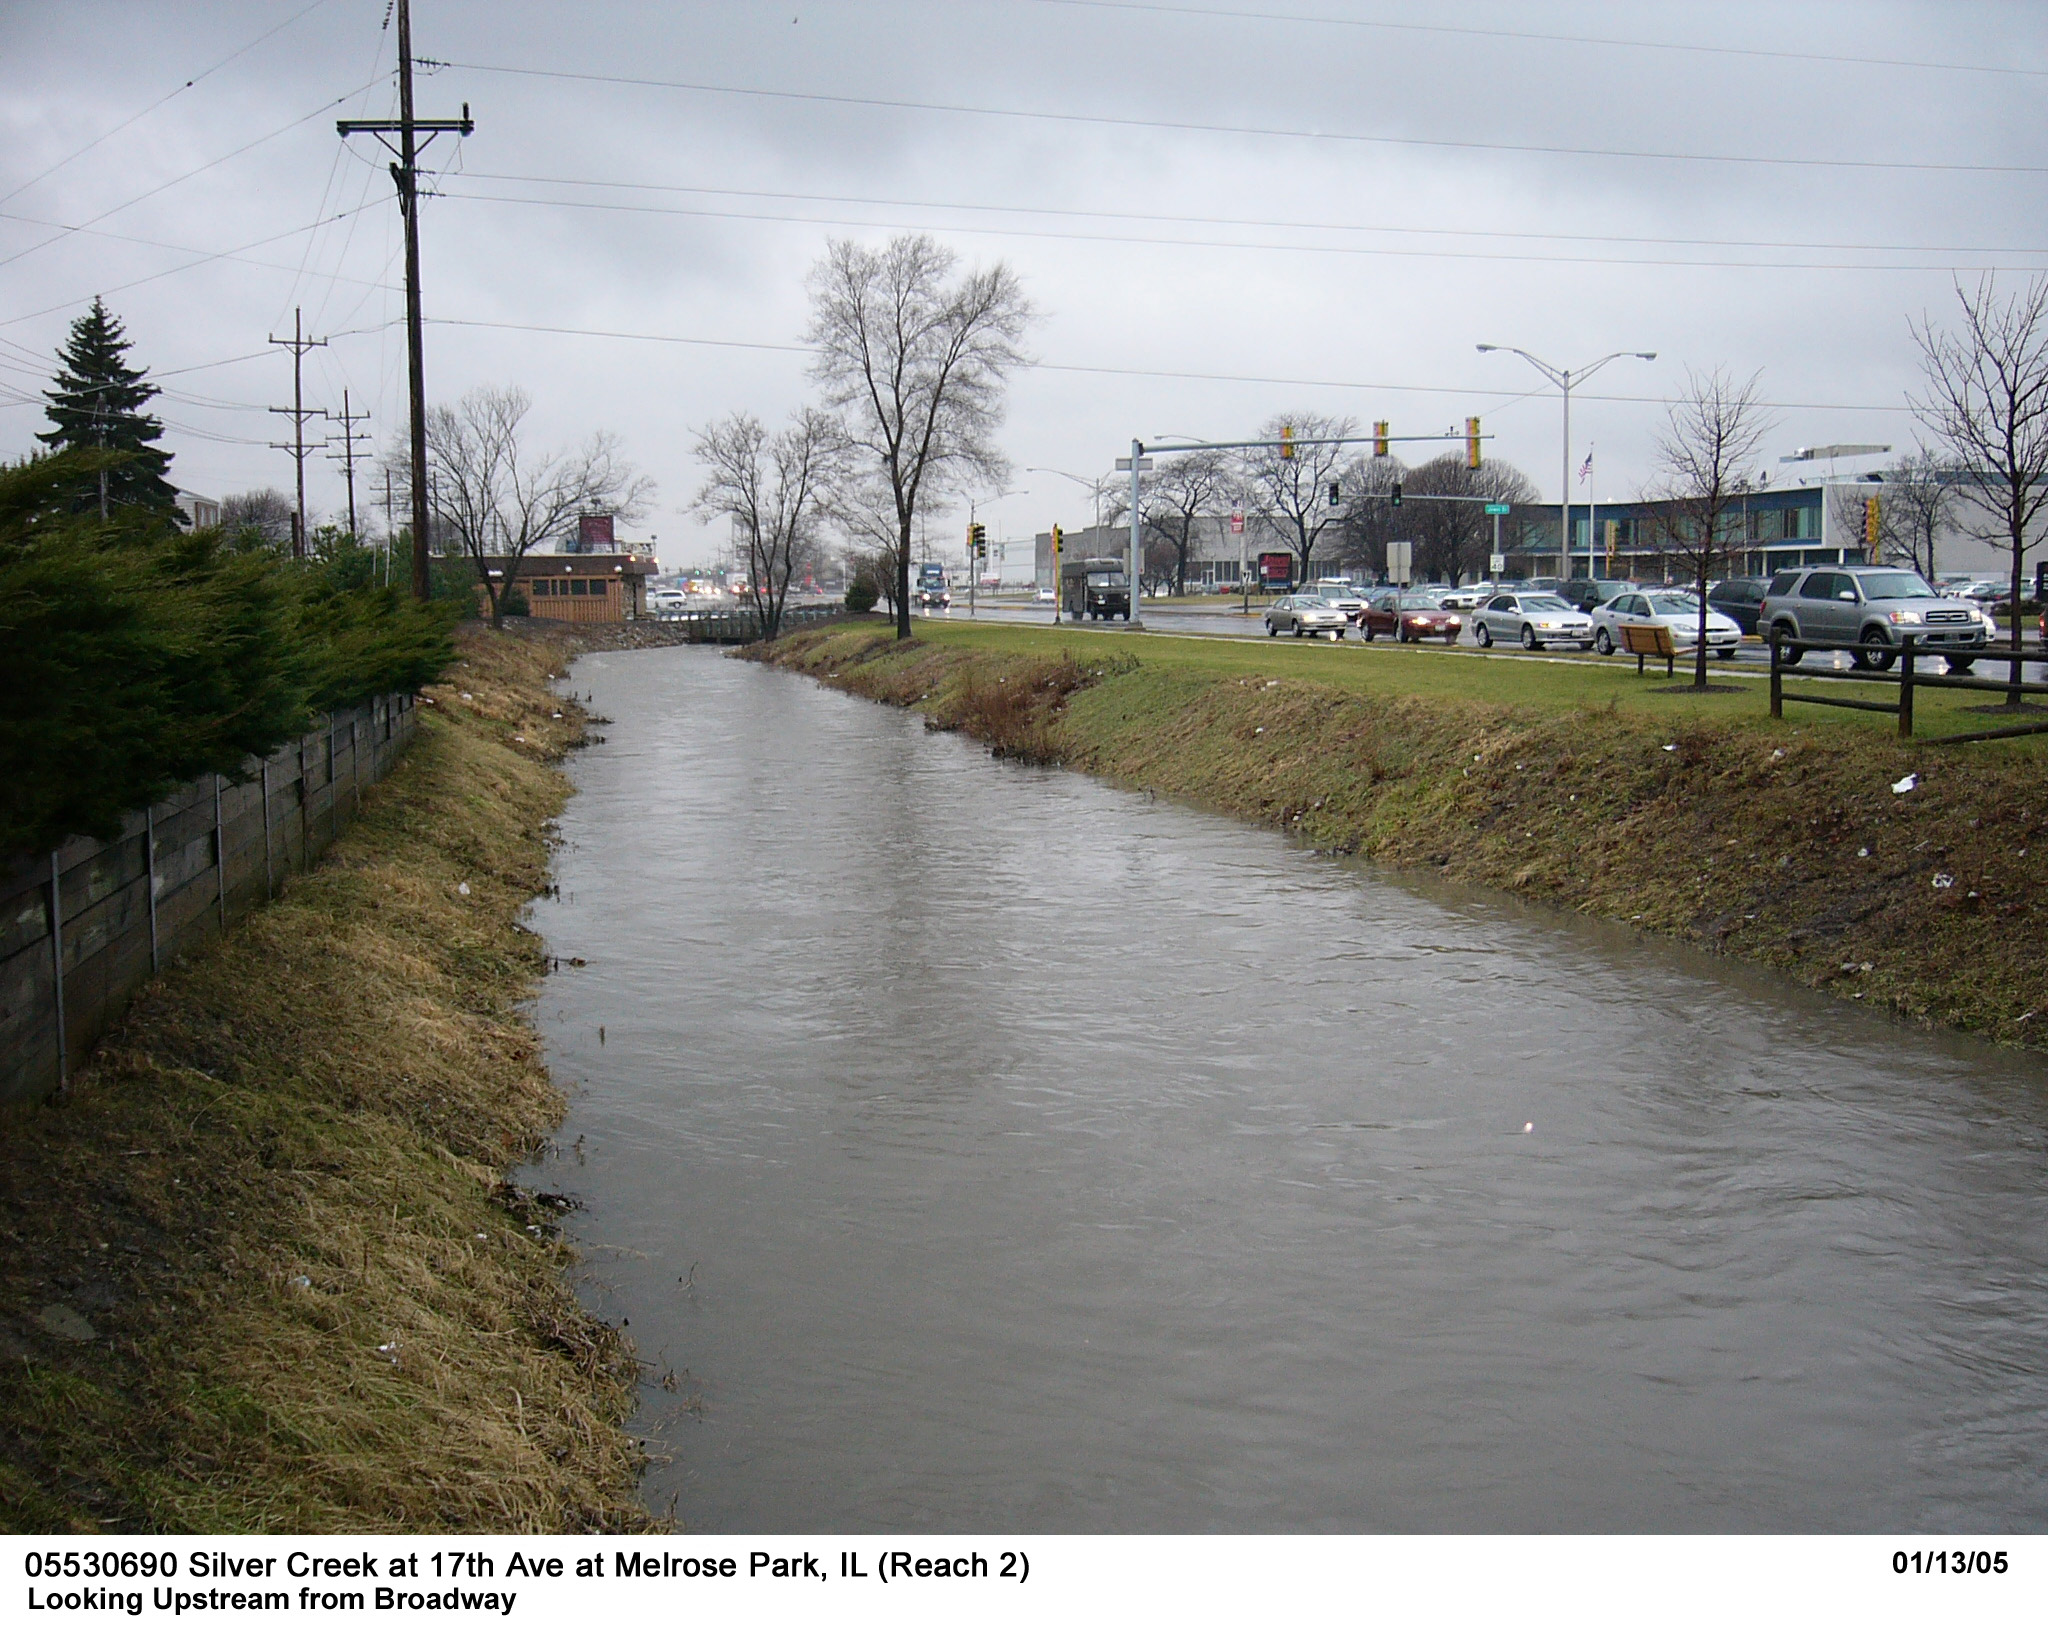
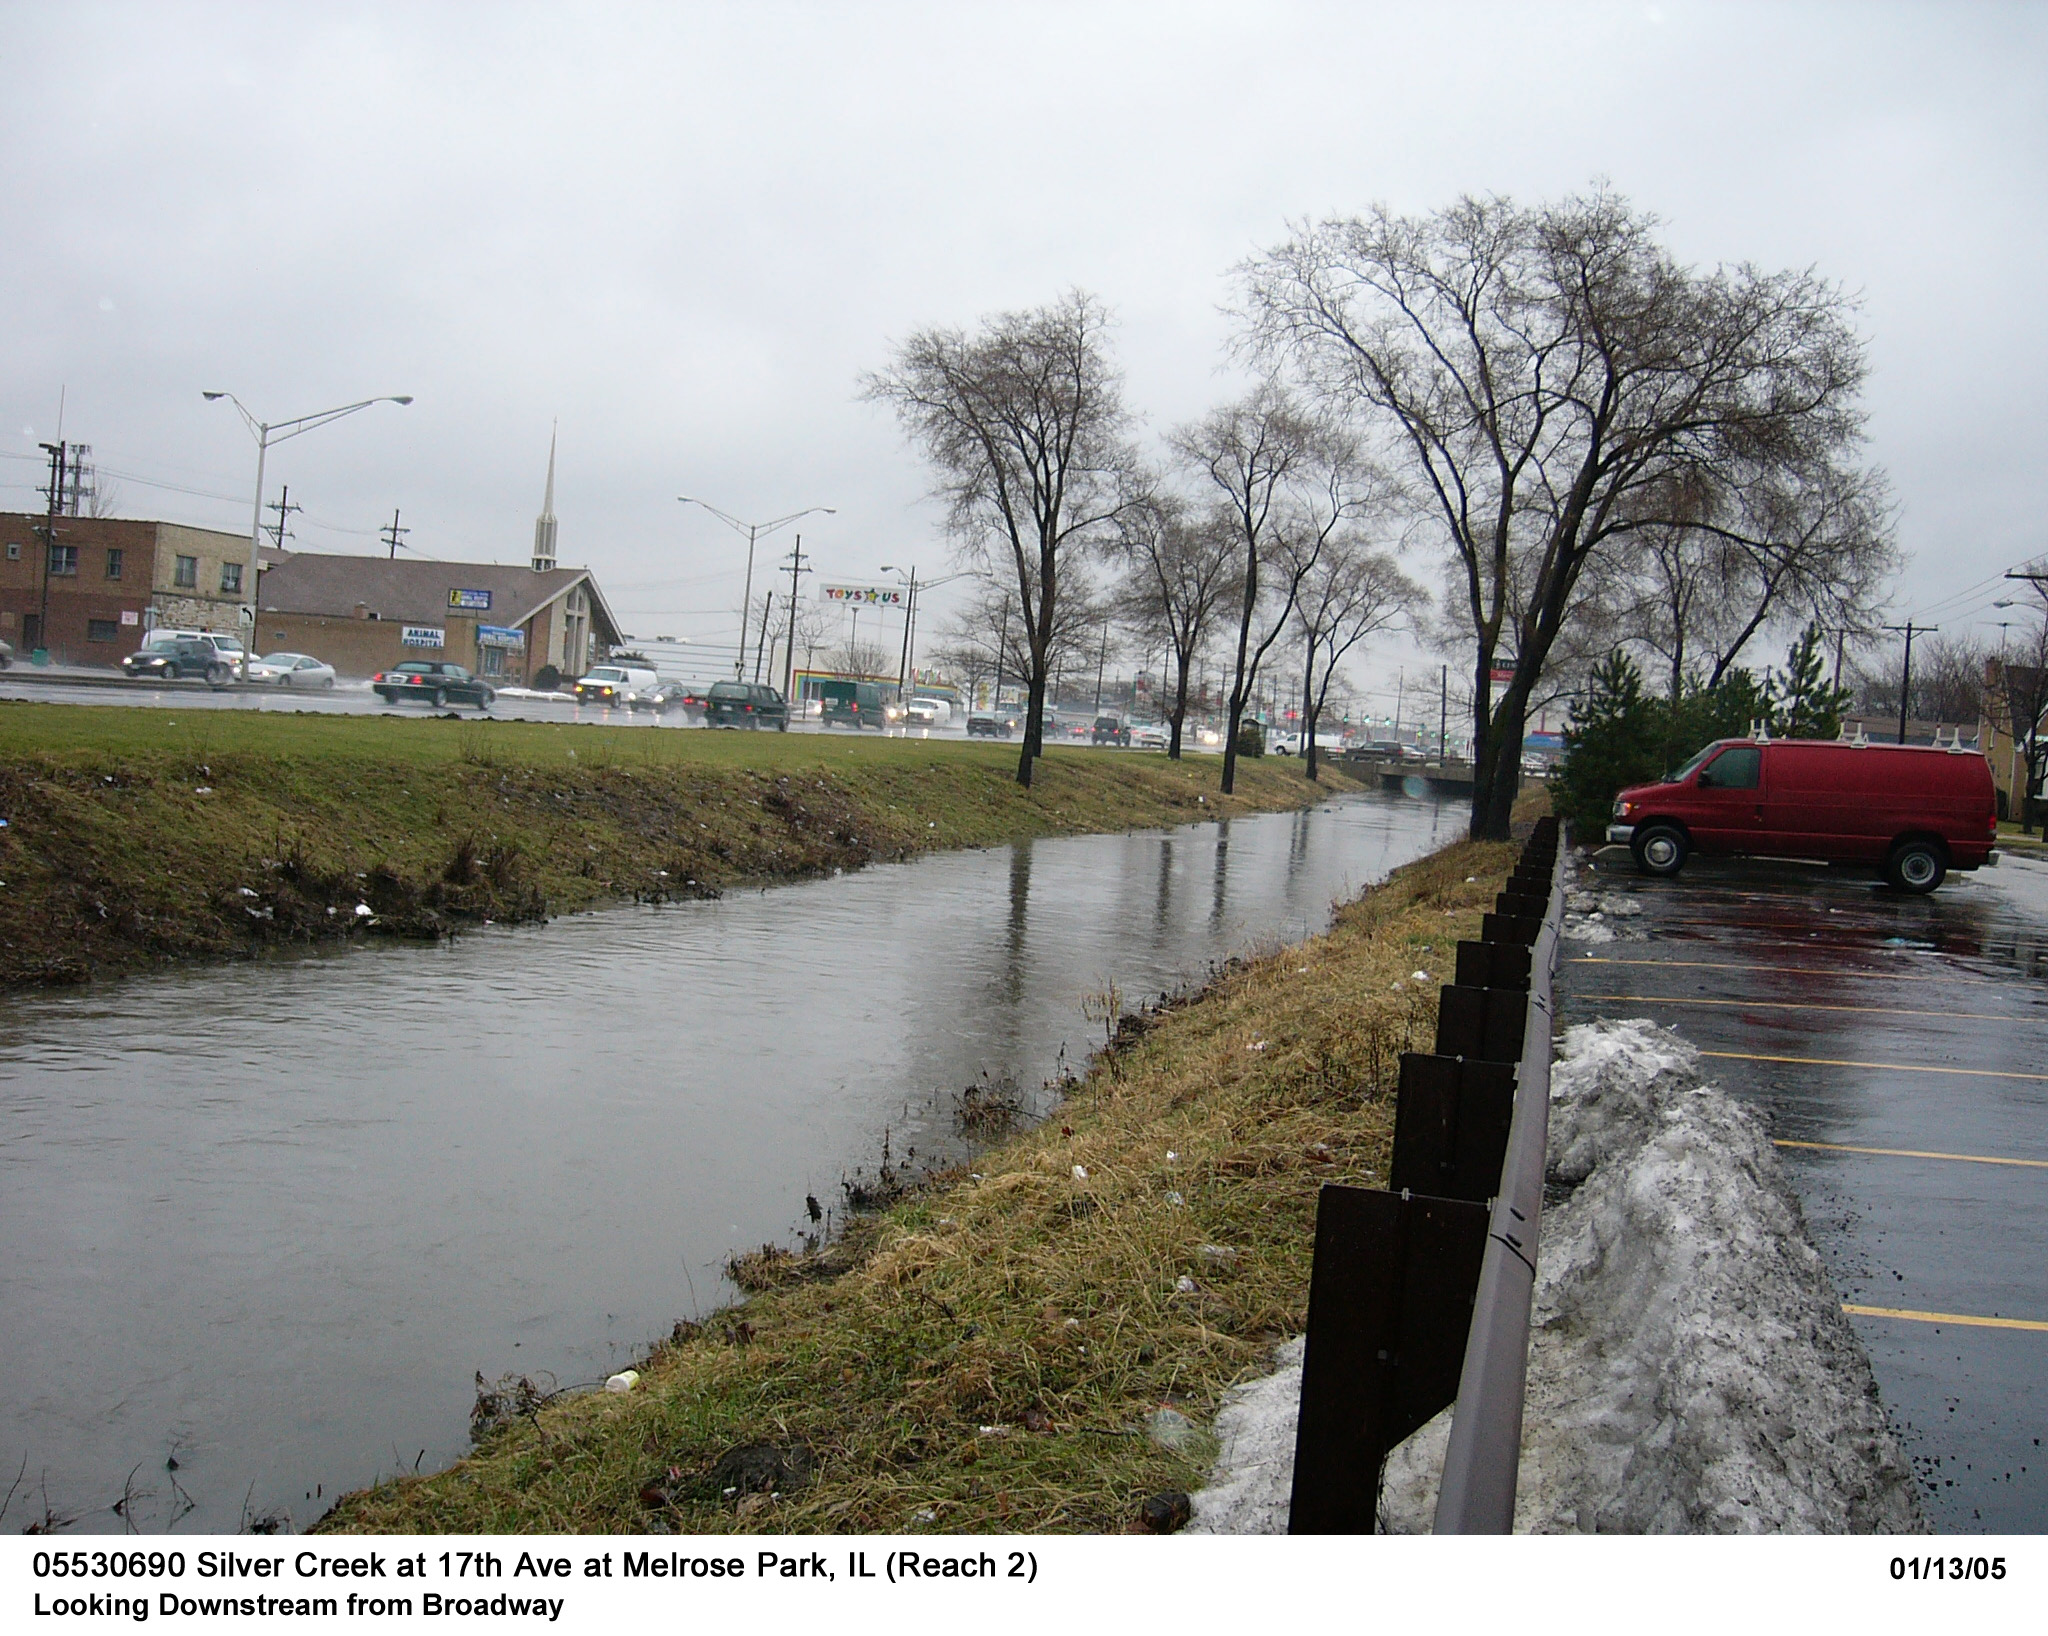
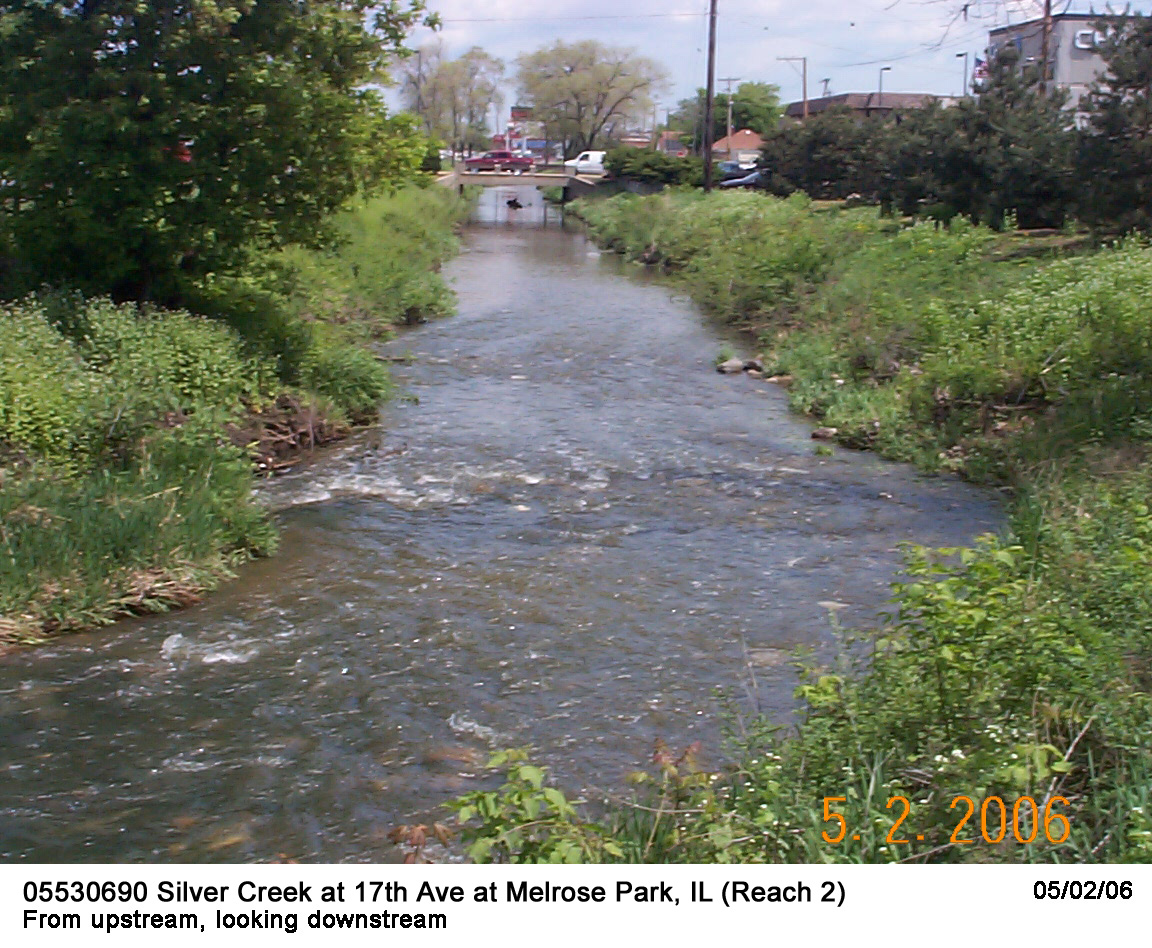
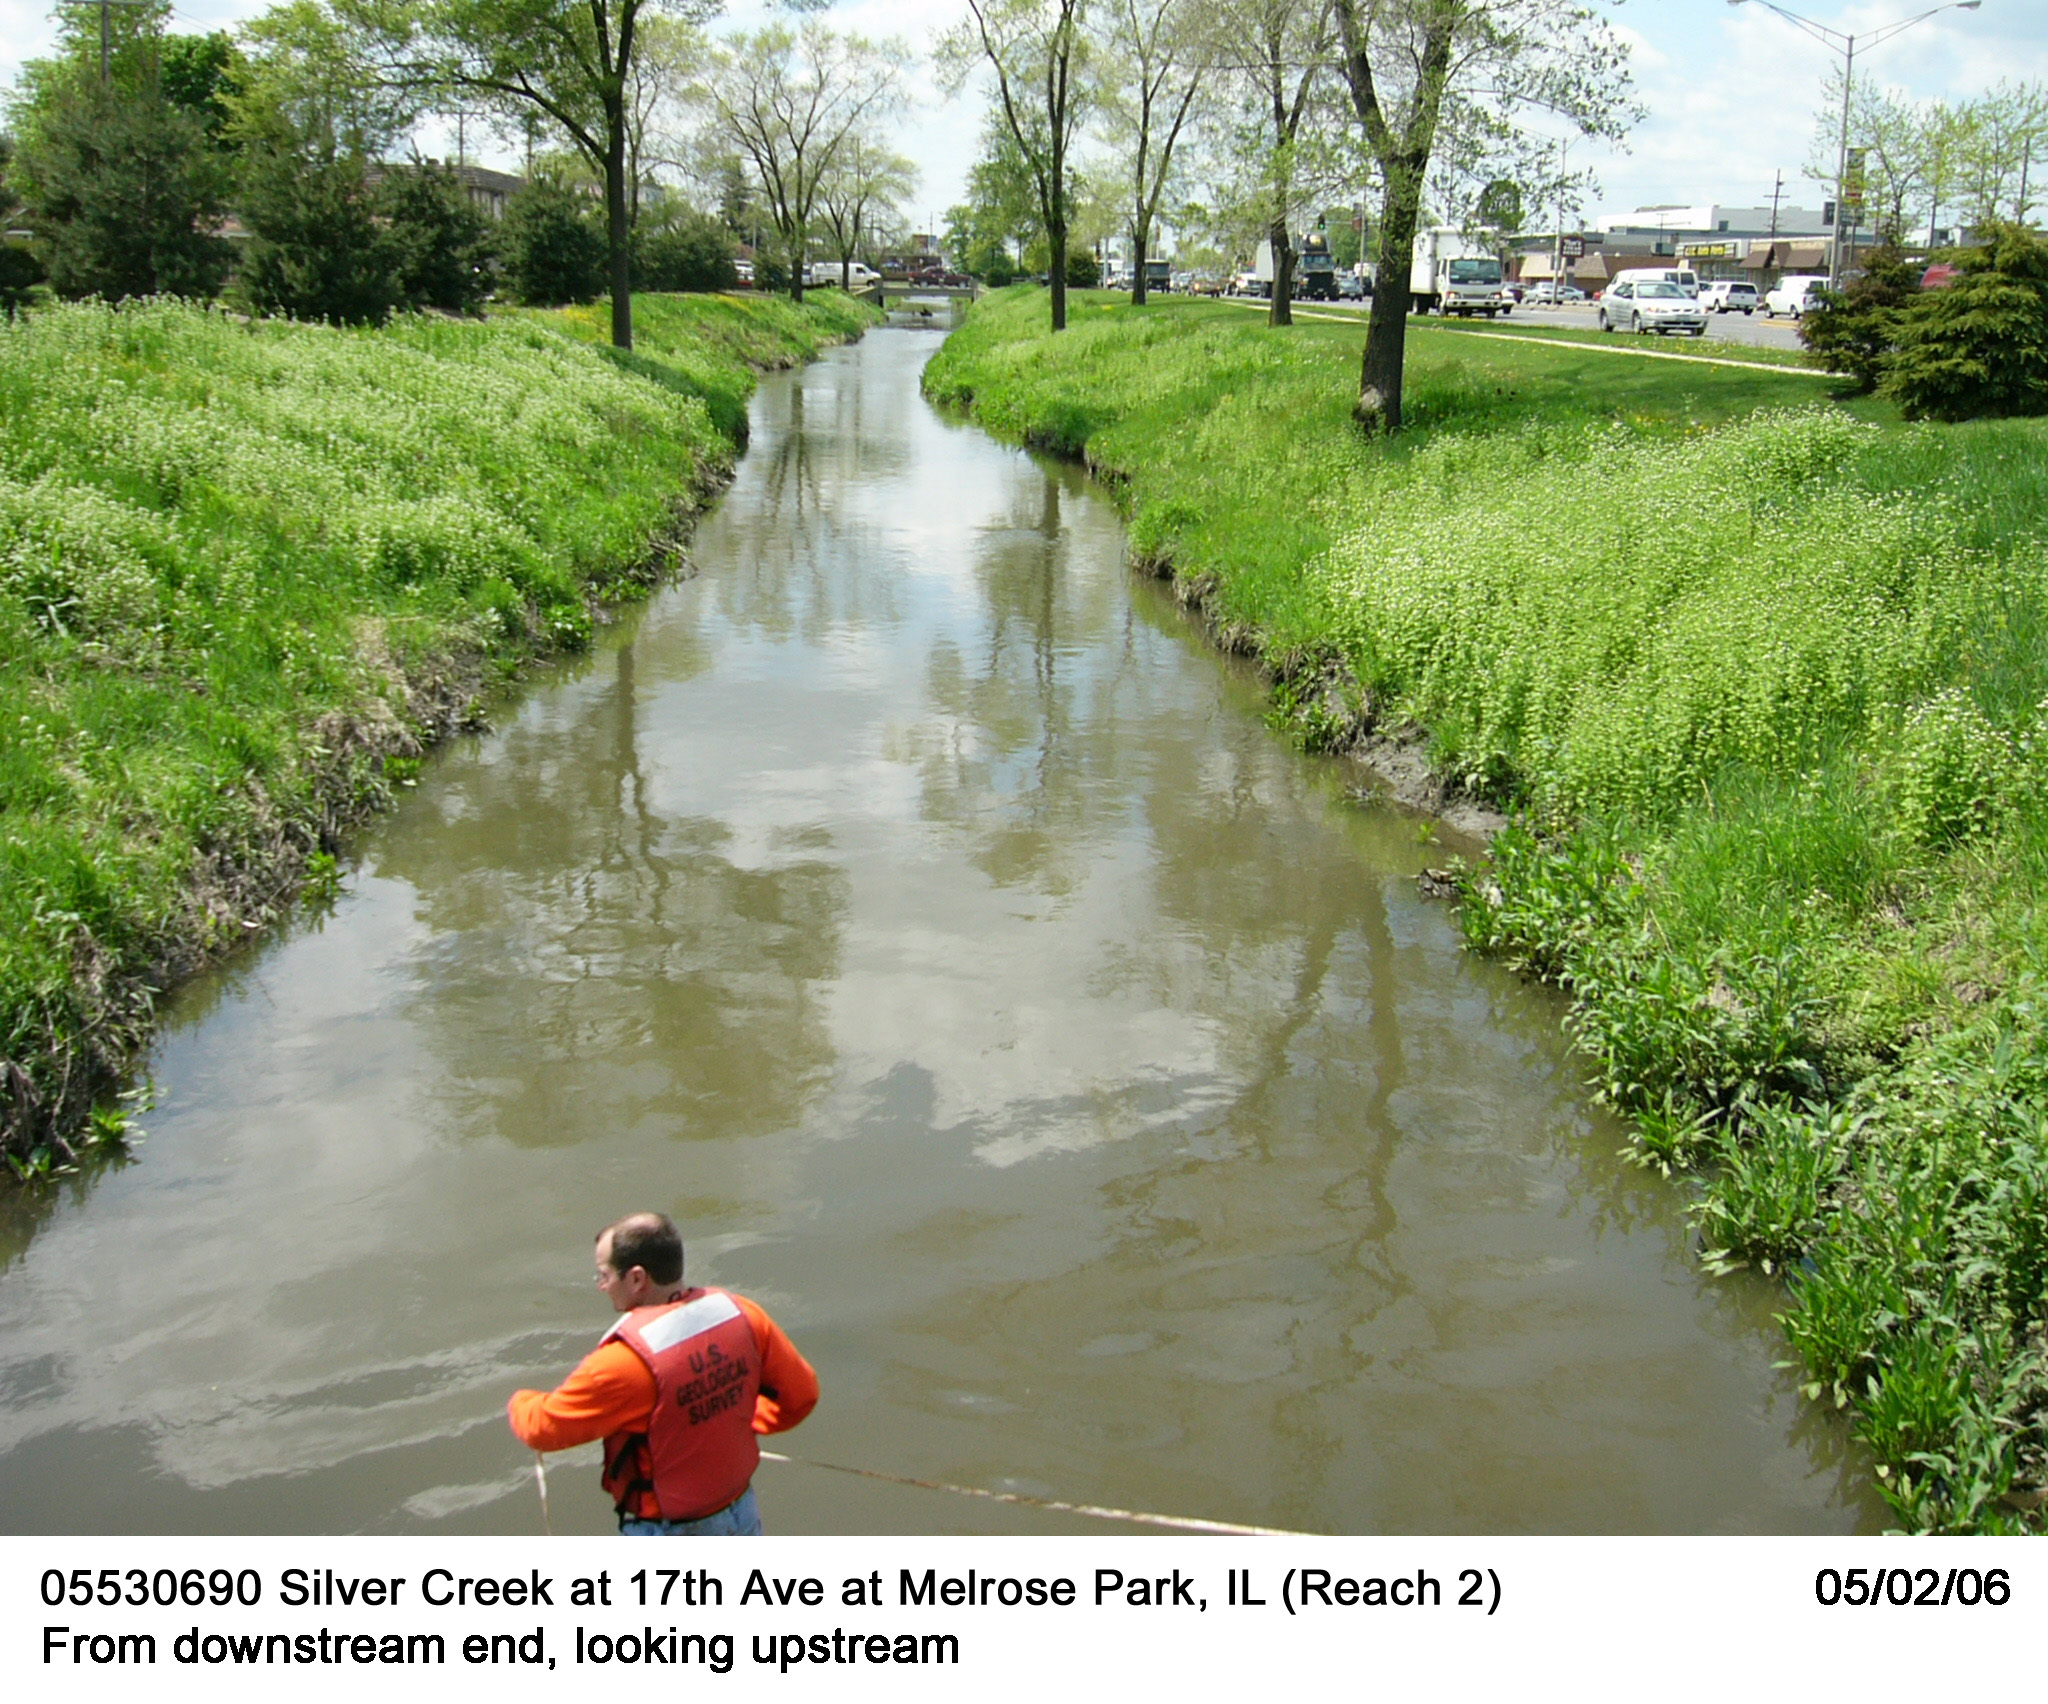
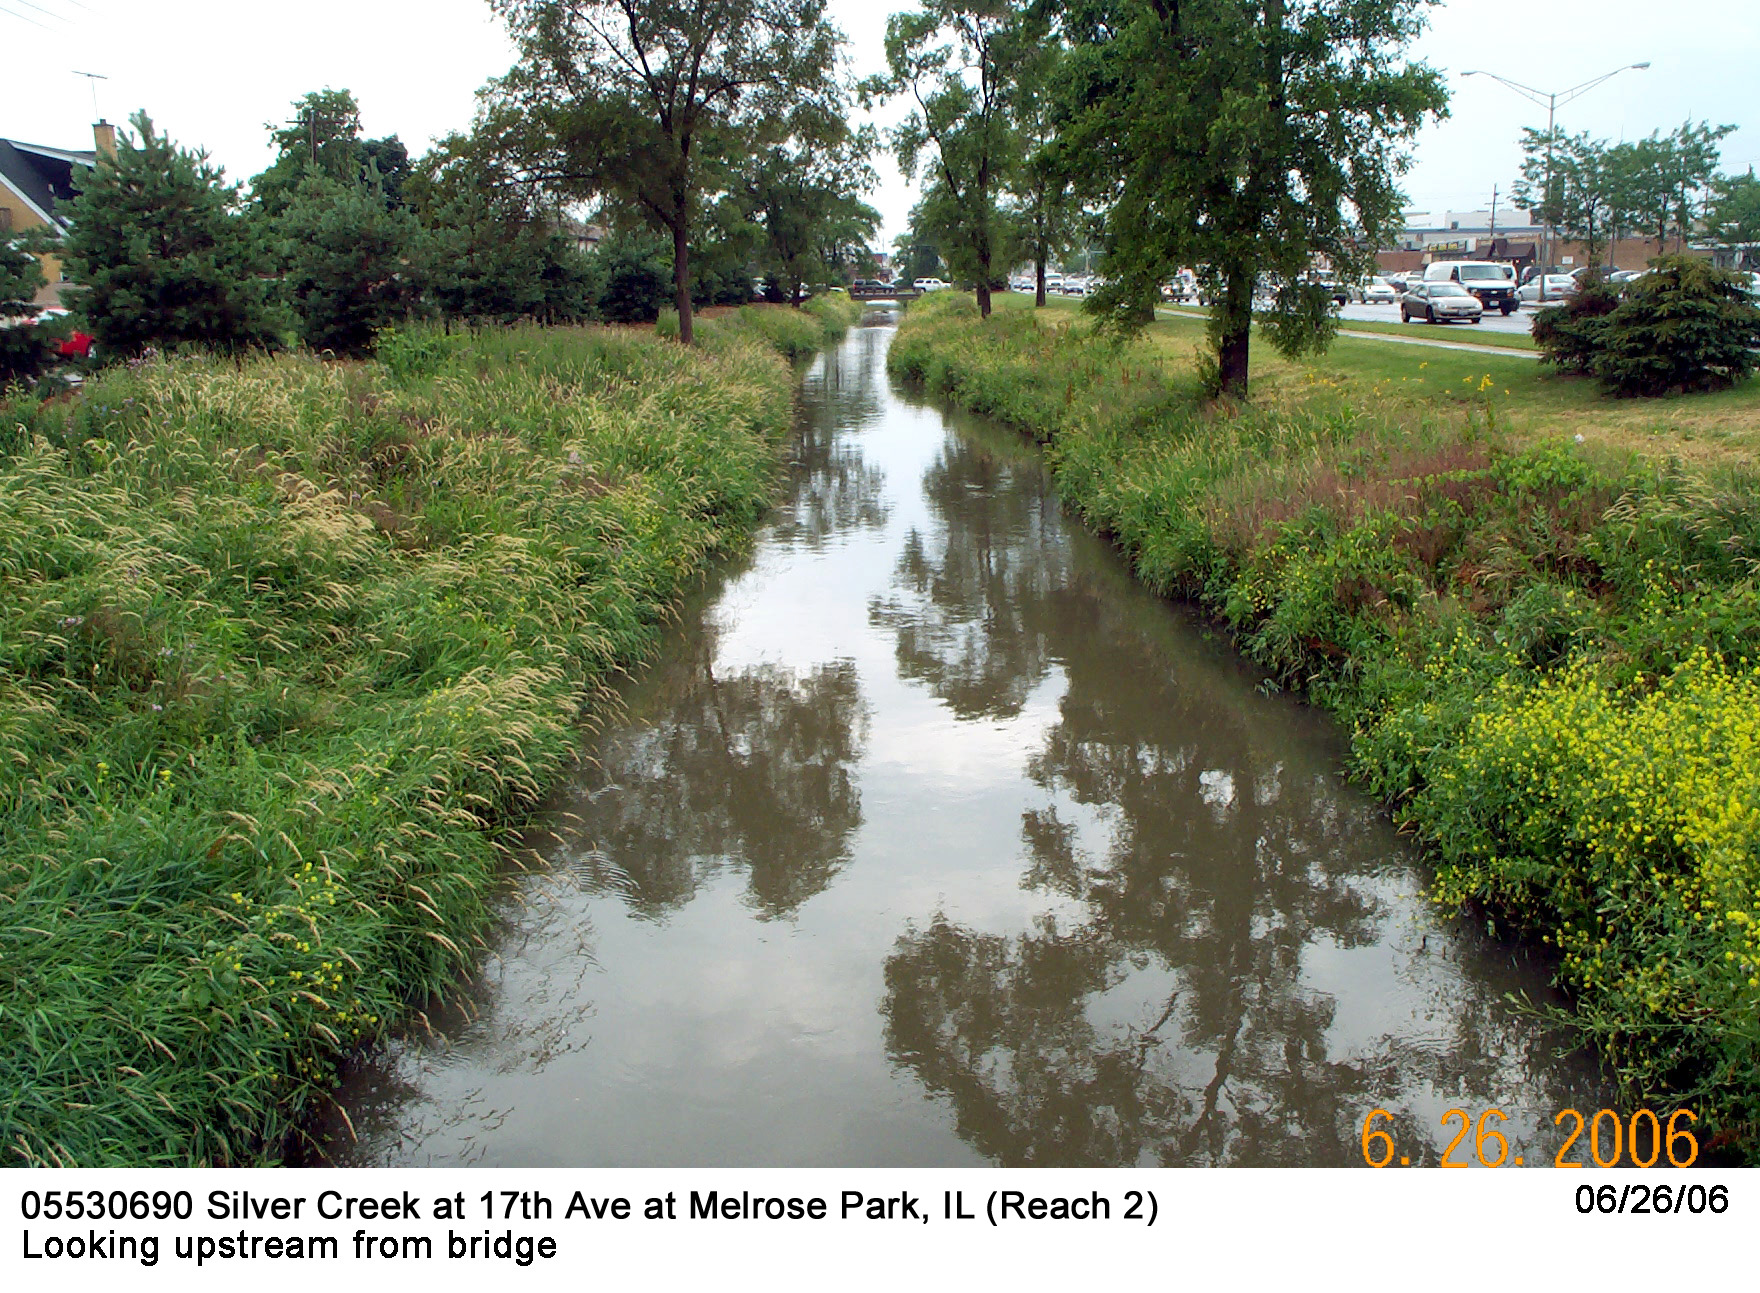
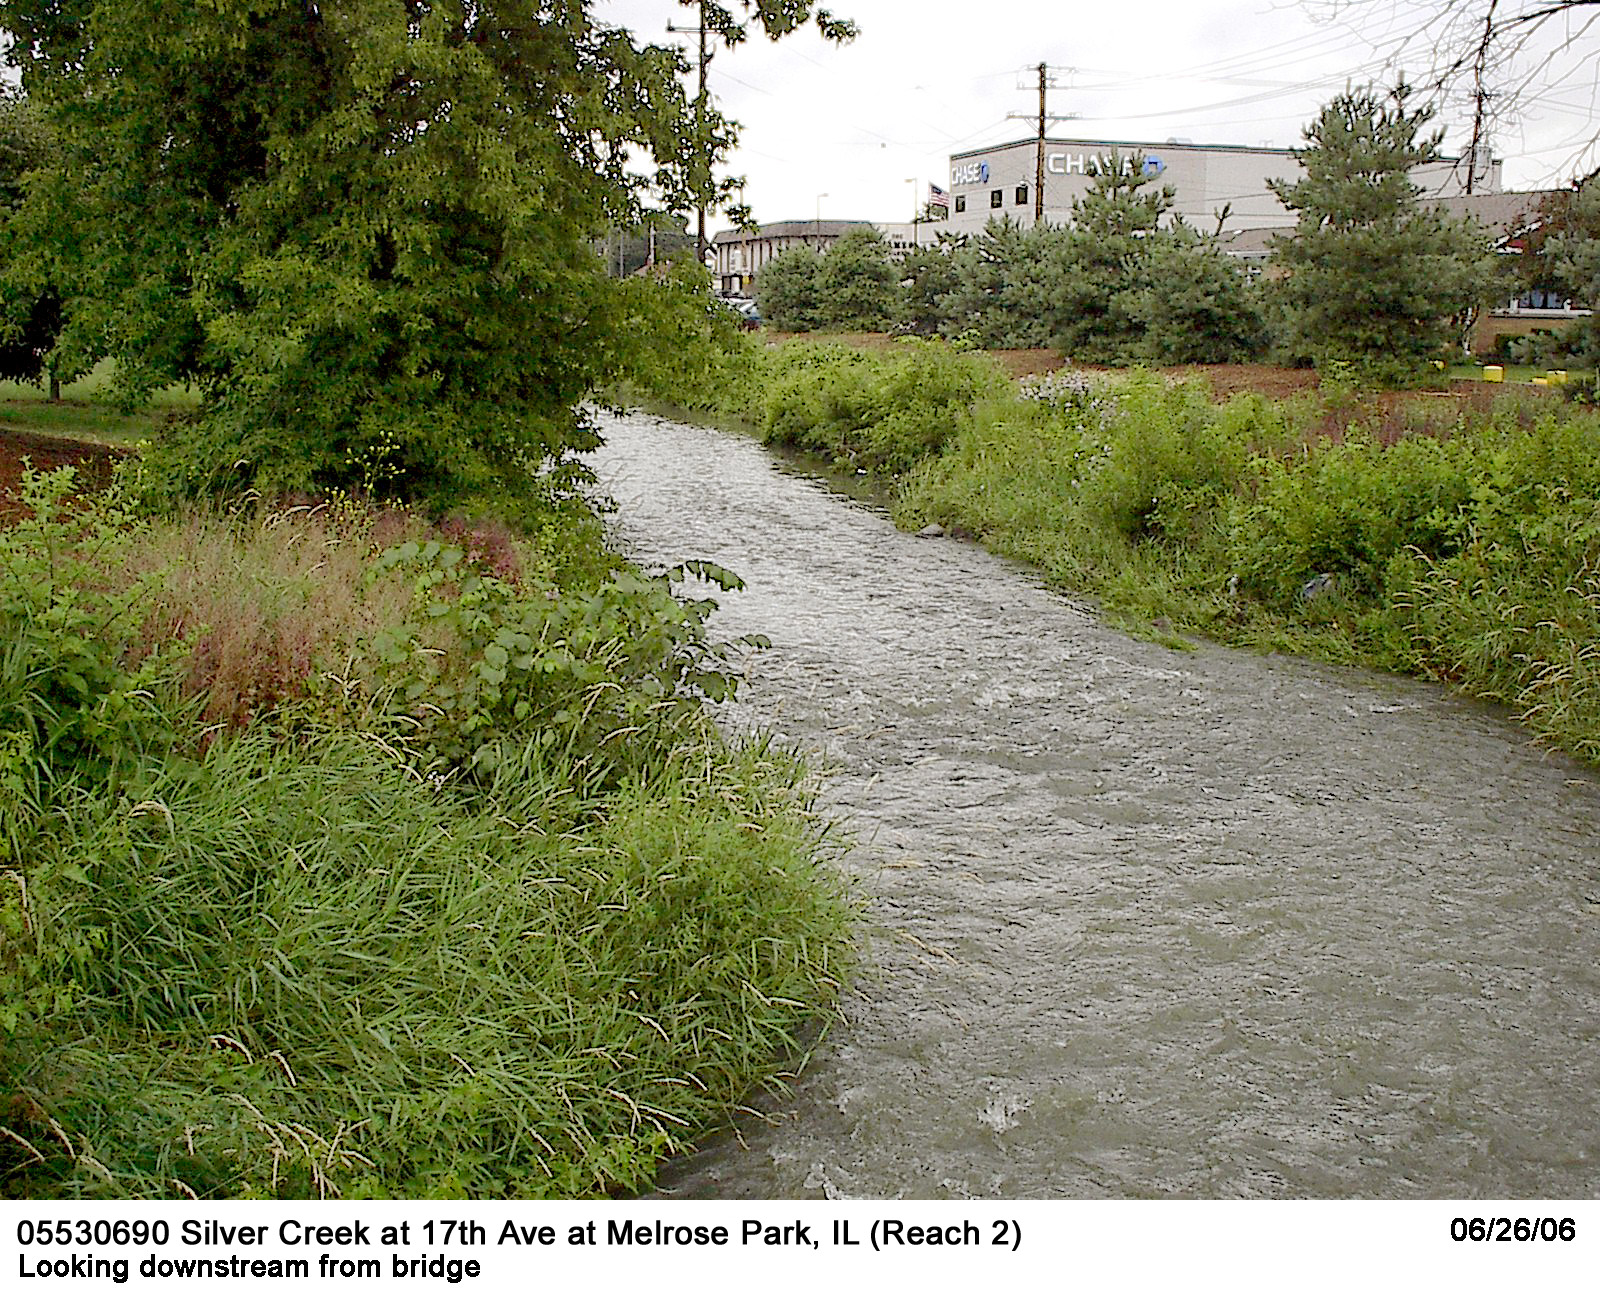
Description of Channel.-- This channel is constructed and has grass banks. Bed materials consist of coarse sand, gravel, and cobbles. Thick algae grows on the channel bed, especially during warm periods. Channel cross sections are trapezoidal in shape with mild bank slope and a top width of about 40 ft. The study reach is straight.
Floods.--Maximum discharge, 15,500 ft3/s, Apr. 13, 1994, gage height, 20.46 ft.

![]() U.S. Department of the Interior |
U.S. Geological Survey
U.S. Department of the Interior |
U.S. Geological Survey
URL: http://il.water.usgs.gov/proj/nvalues/db/sites/05530690.shtml[an error occurred while processing this directive]?
Page Contact Information: David Soong
Page Last Modified: February 4, 2013
