

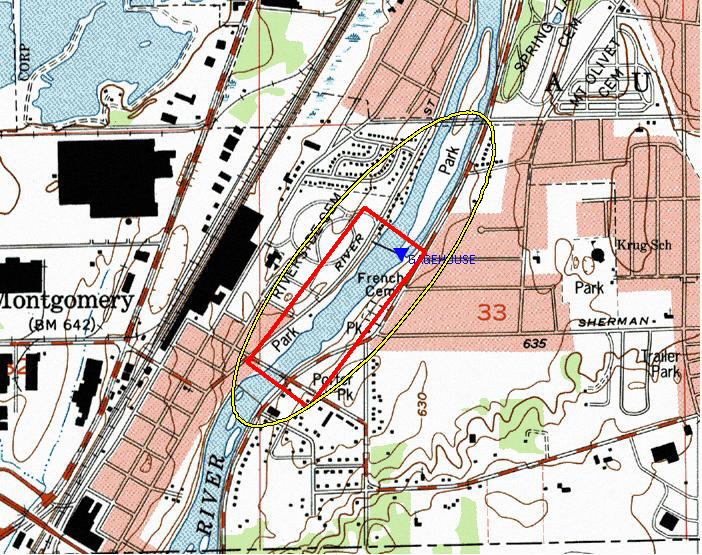
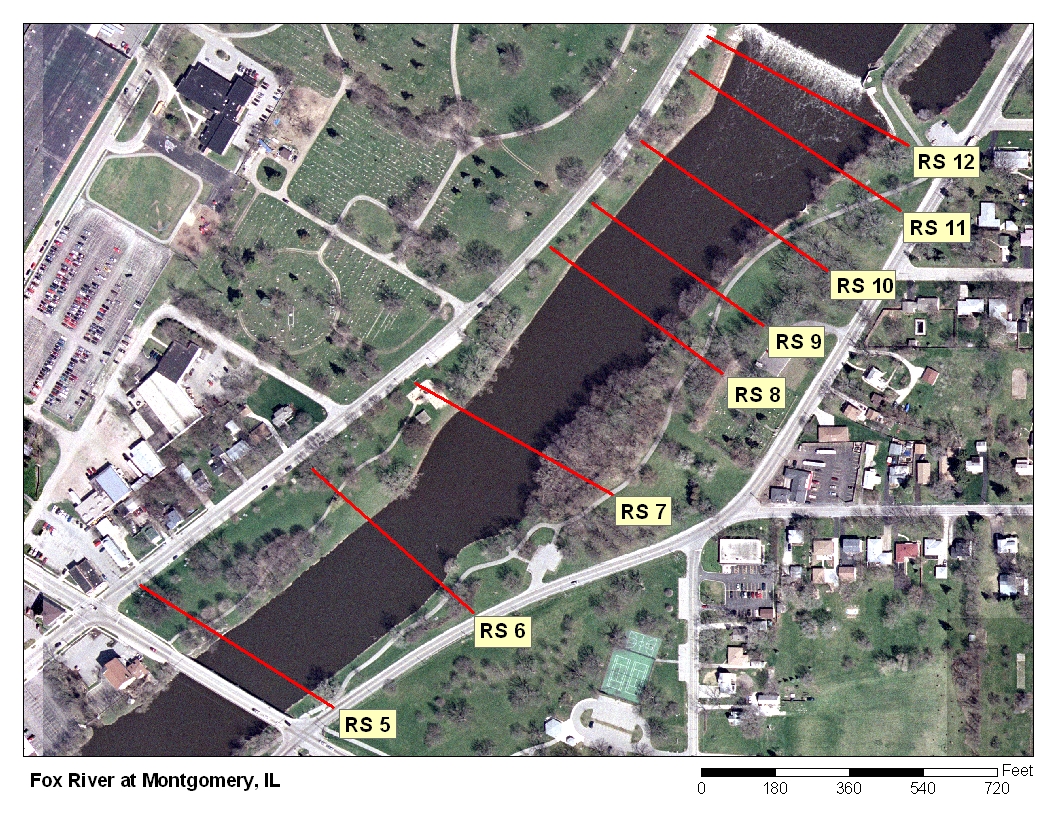
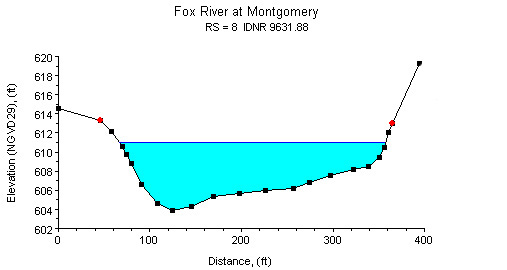
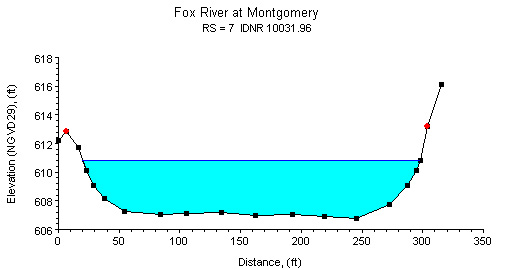
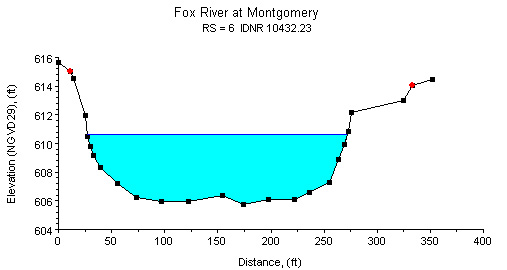
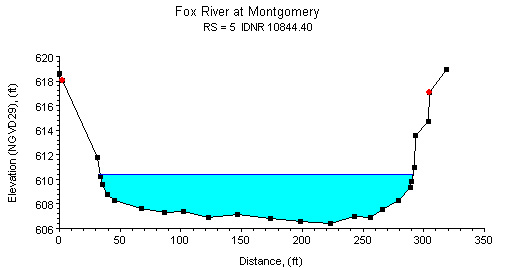
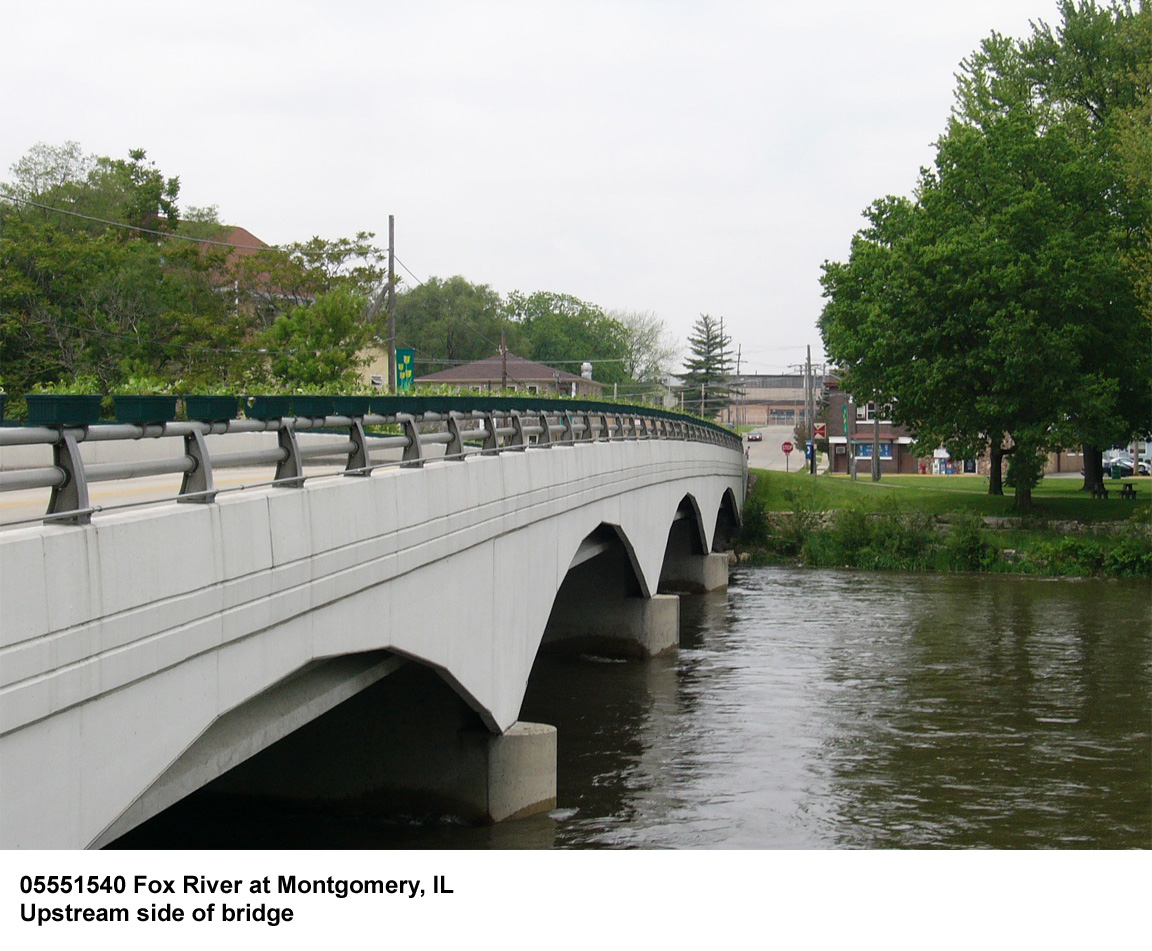
Study Reach.--The channel reach is a wide and natural river. The study reach is approximately 2,110 ft long. It begins 100 ft downstream from the USGS gage house and extends to the upstream side of the Mill Street bridge, as shown in the quadrangle map on the top left. Eight surveyed cross sections (surveyed by the Illinois Department of Natural Resources, in September 2003) are available for describing the channel geometries of the study reach. The channel alignment, approximate variations in channel width and bank conditions, and the locations of the cross sections are shown in the aerial photograph on the top right. Four cross sections at river stations (RS) 8, 7, 6, and 5 (see plots above) are considered representative of general cross sectional-shapes in the study reach.
Gage Location.--Lat 41°43'46", long 88°20'19", in NW1/4 SE1/4 sec.33, T.38N., R.8E., Kane County, Hydrologic Unit 07120007, on the left bank at the dam, 0.4 mi upstream from the Mill Street bridge, 0.2 mi east of Montgomery, 3.2 mi upstream of Waubansee Creek, and at river mile 45.9. The USGS streamgage station number is 05551540.
Drainage Area.--1732 sq mi.
Gage Datum and Elevations of Reference Points.--Datum of the gage is 603.520 ft. A tailwater wire-weight gage (WWG) is located on the downstream side of the left dam abutment near the gage house. A reference point for the n-value study, RP-N1, is located at the downstream end of the study reach on the upstream side of the Mill Street bridge. RP-N1 is the top of a nut on the concrete anchor 130 ft from the left end of the bridge, elevation=626.889 ft. All elevations are referenced to NGVD29.
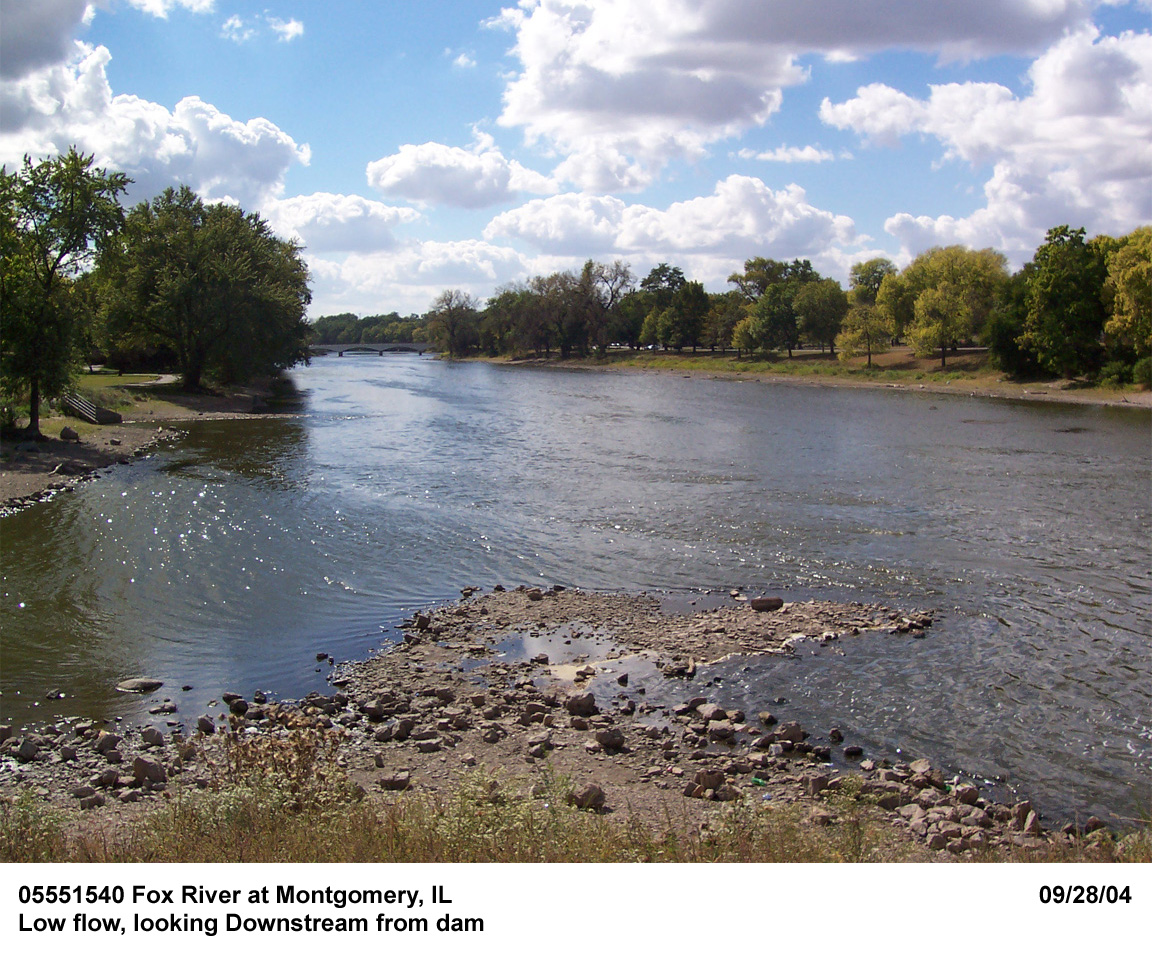
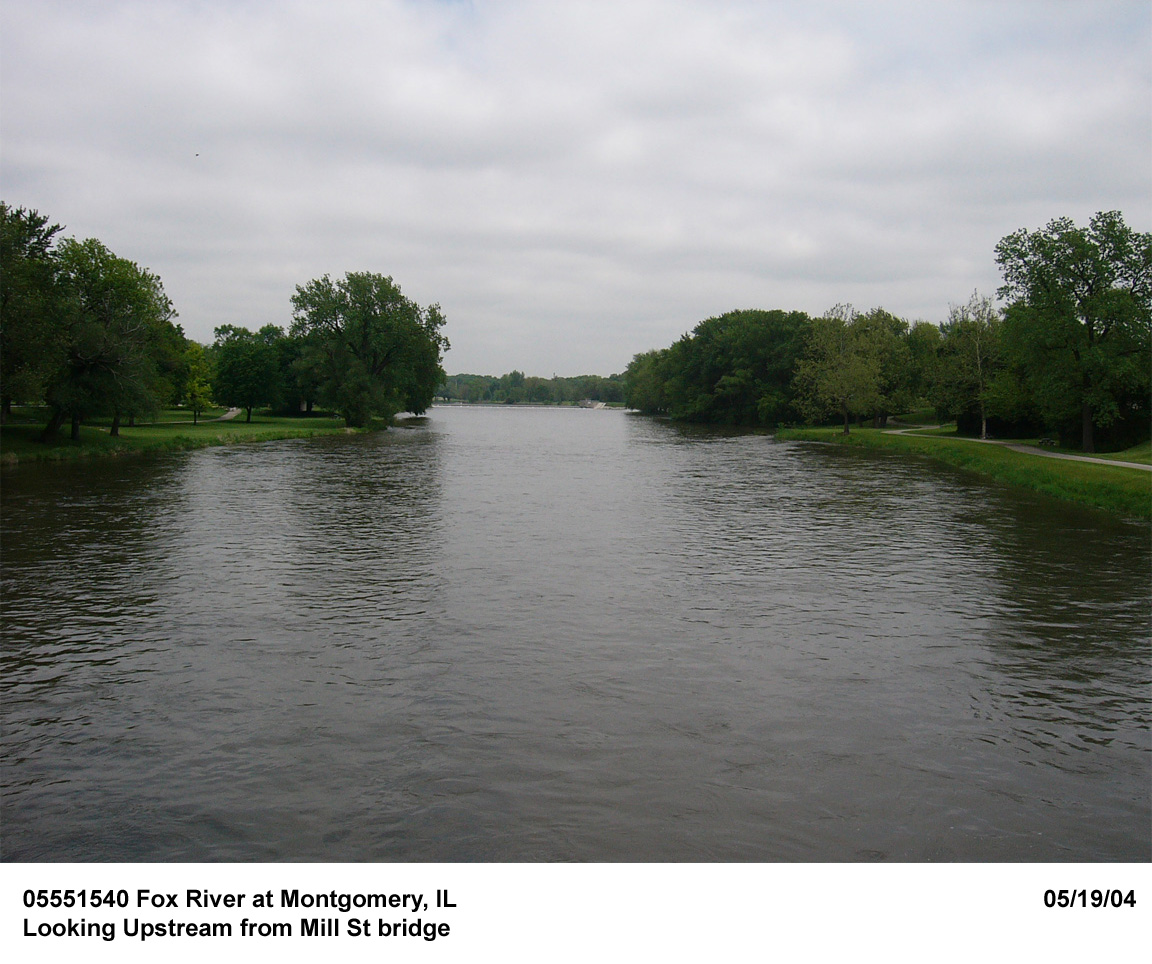
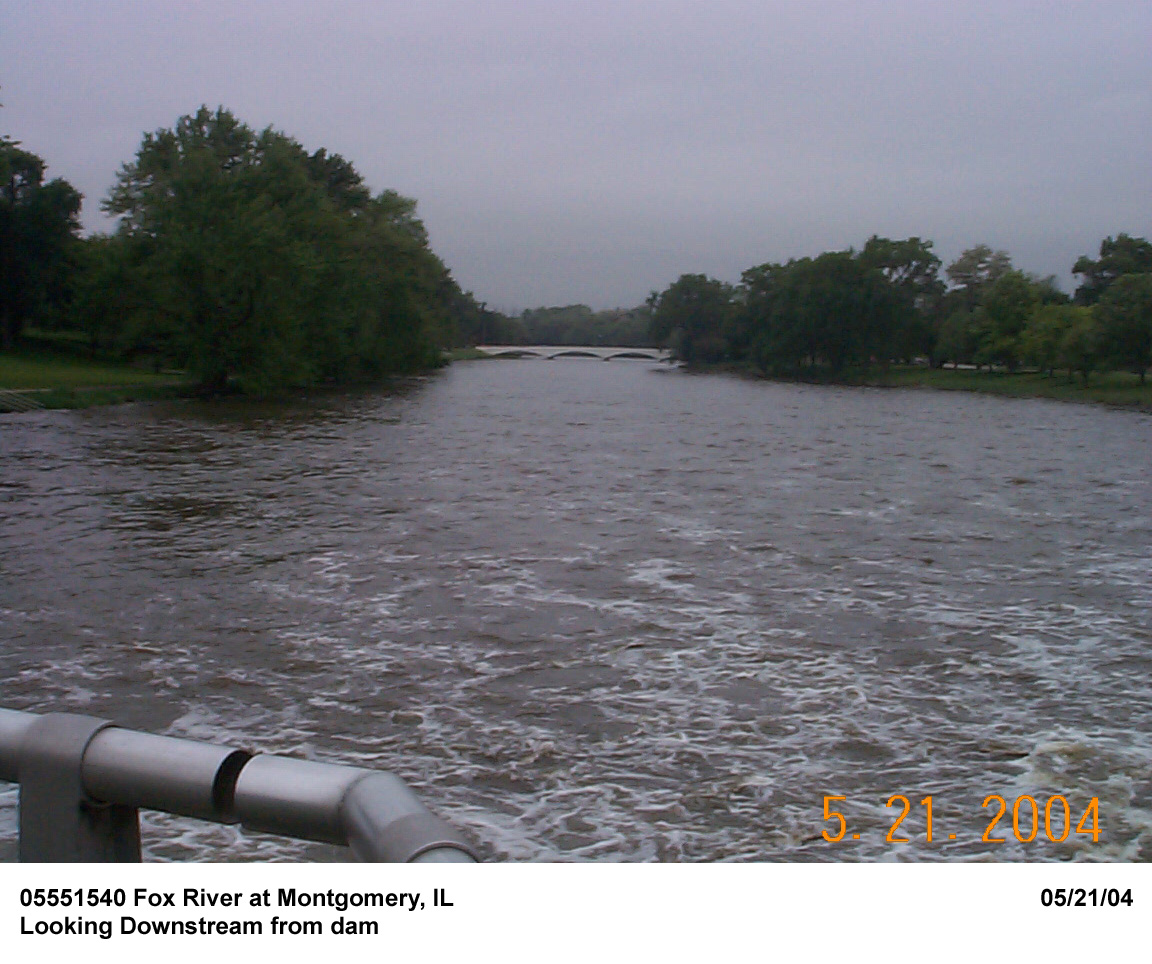
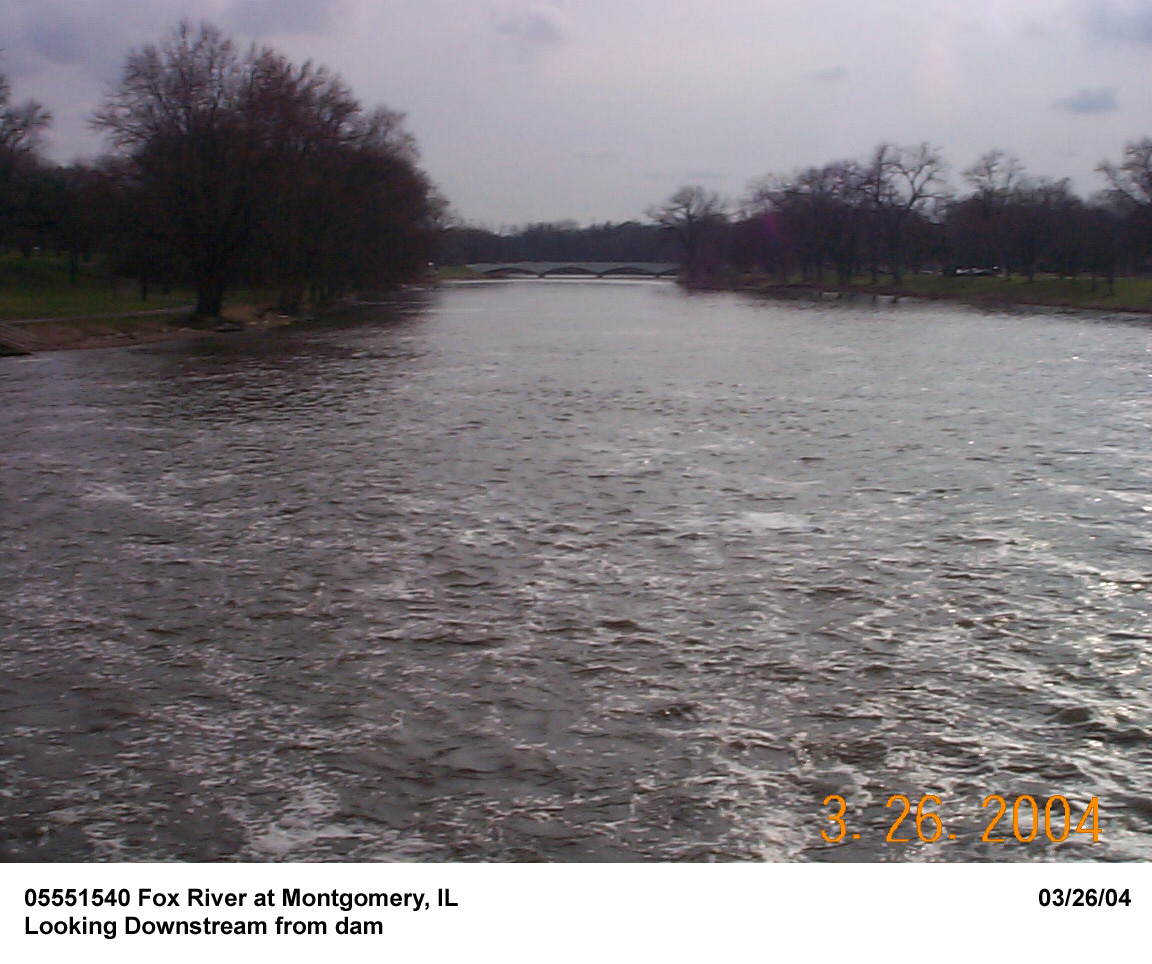
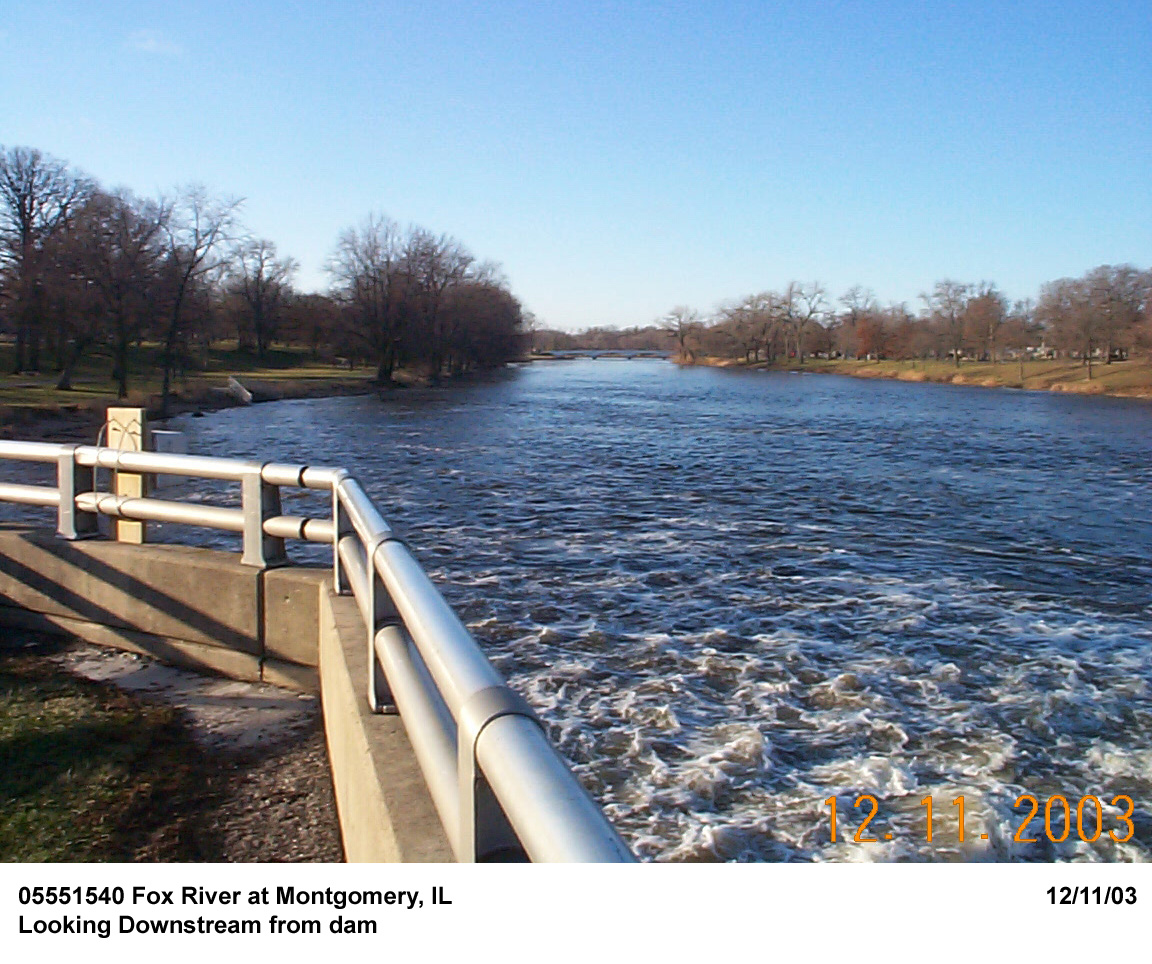
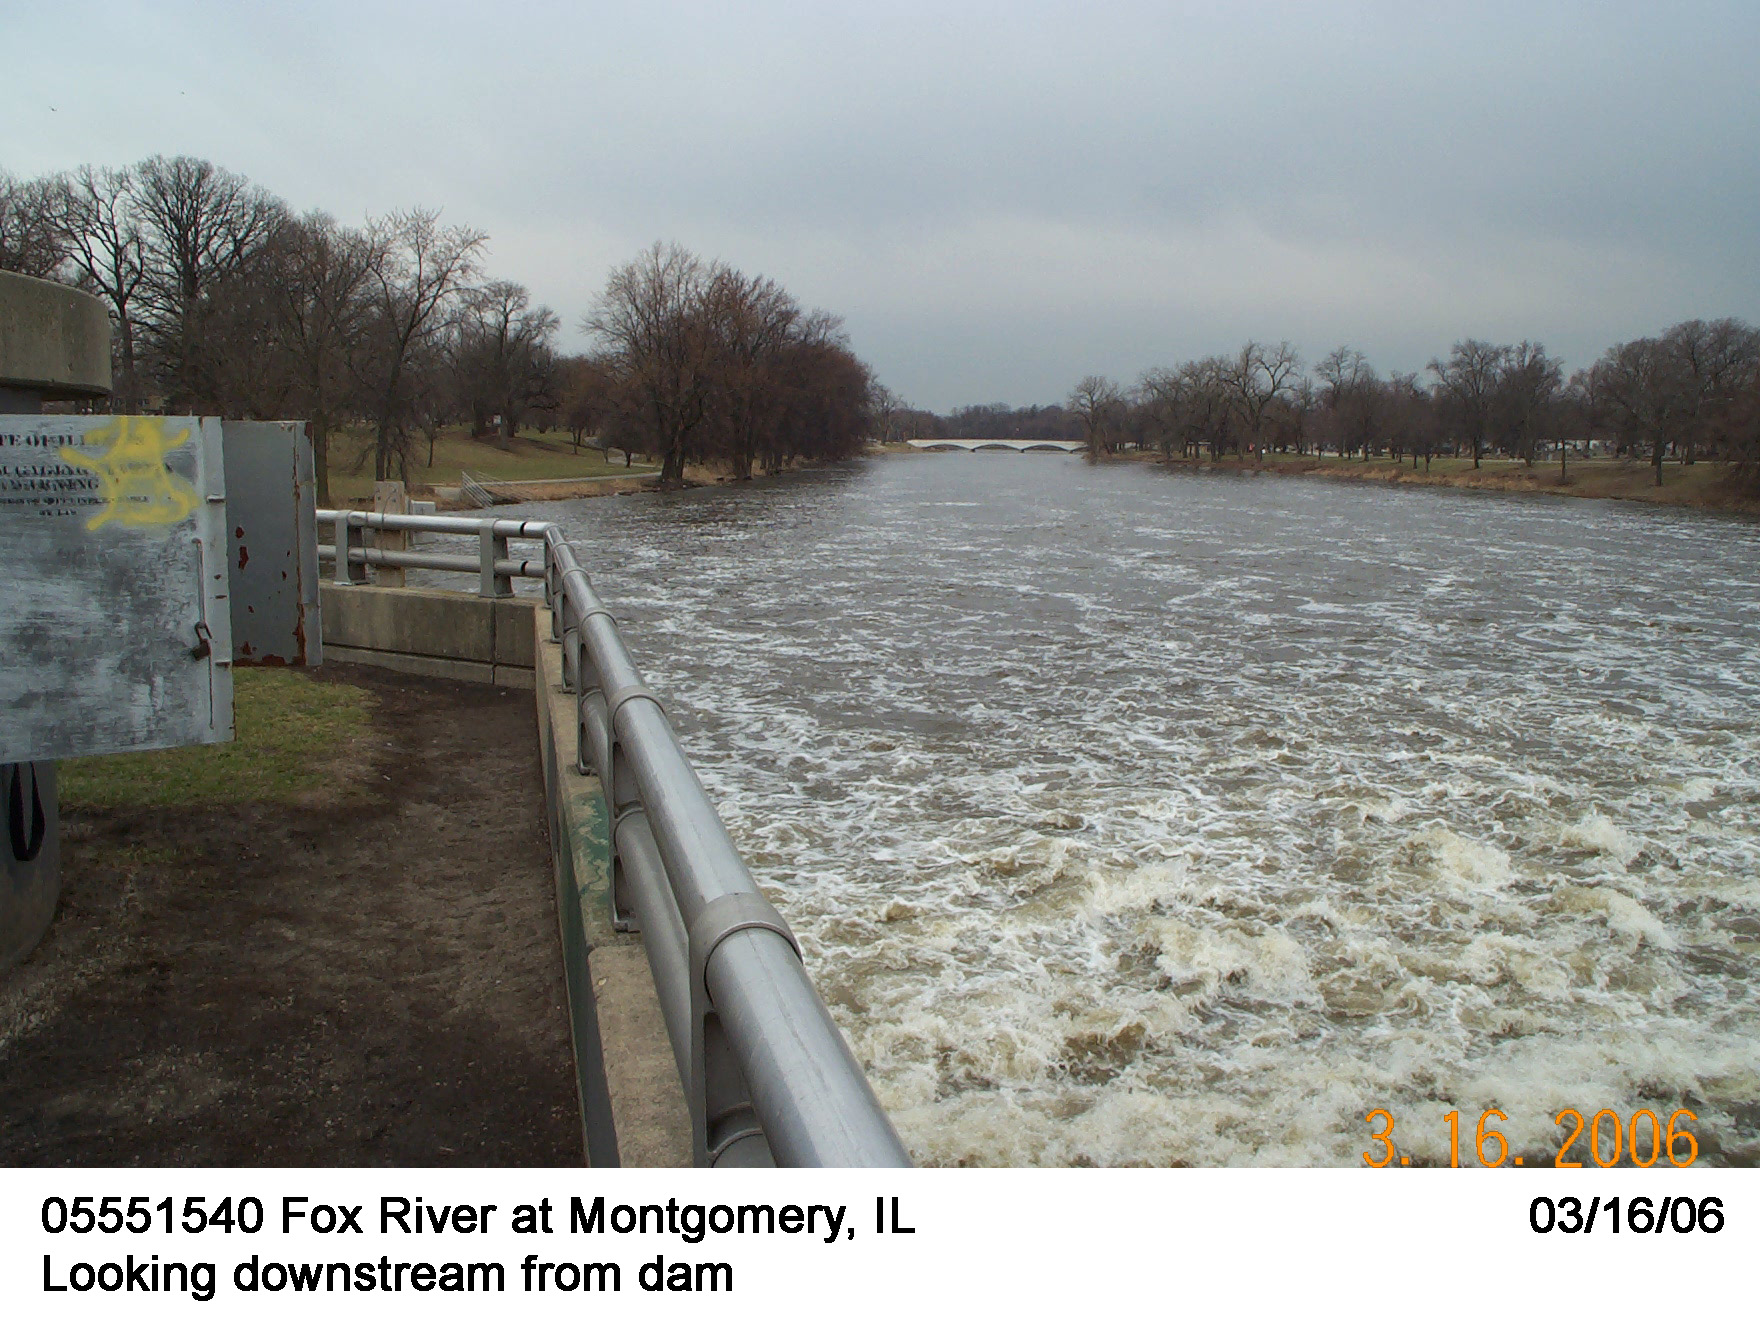
Stage, Discharge Measurements, and Computed n-Values.--Water-surface elevations were measured using the tailwater WWG at the upstream end of the study reach and at RP-N1 at the downstream end before and after each discharge measurement. Discharge measurements were made using the conventional current-meter method. The computed n-values are listed in the following table. Whenever possible, the computed n-values are associated with a photograph taken at the time of the measurement. The photographs are arranged from low to high discharge in order to illustrate the contributing factors of n-values at a particular discharge.
| Date of Observation | Discharge (ft3/s) | Average Cross Section Area (ft2) | Hydraulic Radius (ft) | Mean Velocity (ft/s) | Slope (ft/ft) | Coefficient of Roughness n |
|---|---|---|---|---|---|---|
| 7/9/2004 | 1440.0 | 897.2 | 3.11 | 1.67 | 0.000327 | 0.032 |
| 2/1/2006 | 1700.0 | 978.0 | 3.35 | 1.80 | 0.000306 | 0.031 |
| 3/26/2004 | 2230.0 | 1124.6 | 3.78 | 2.05 | 0.000367 | 0.030 |
| 12/11/2003 | 2360.0 | 1168.7 | 3.90 | 2.08 | 0.000345 | 0.030 |
| 3/16/2006 | 3540.0 | 1305.8 | 4.29 | 2.79 | 0.000263 | 0.022 |
| 7/29/2010 | 3820.0 | 1410.2 | 4.59 | 2.79 | 0.000333 | 0.024 |
| 5/19/2004 | 4640.0 | 1518.3 | 4.89 | 3.14 | 0.000291 | 0.021 |
| 5/21/2004 | 4790.0 | 1573.8 | 5.04 | 3.13 | 0.000383 | 0.023 |

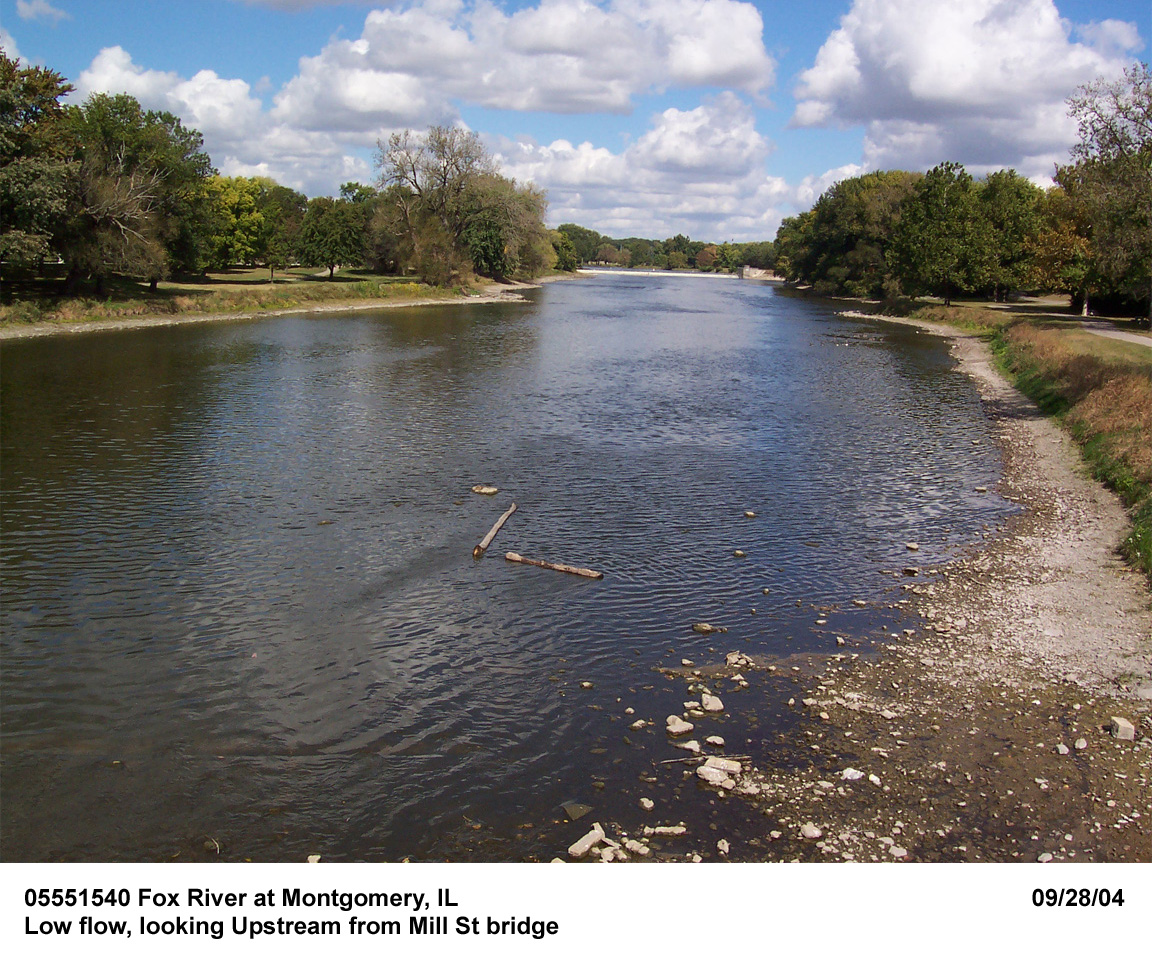
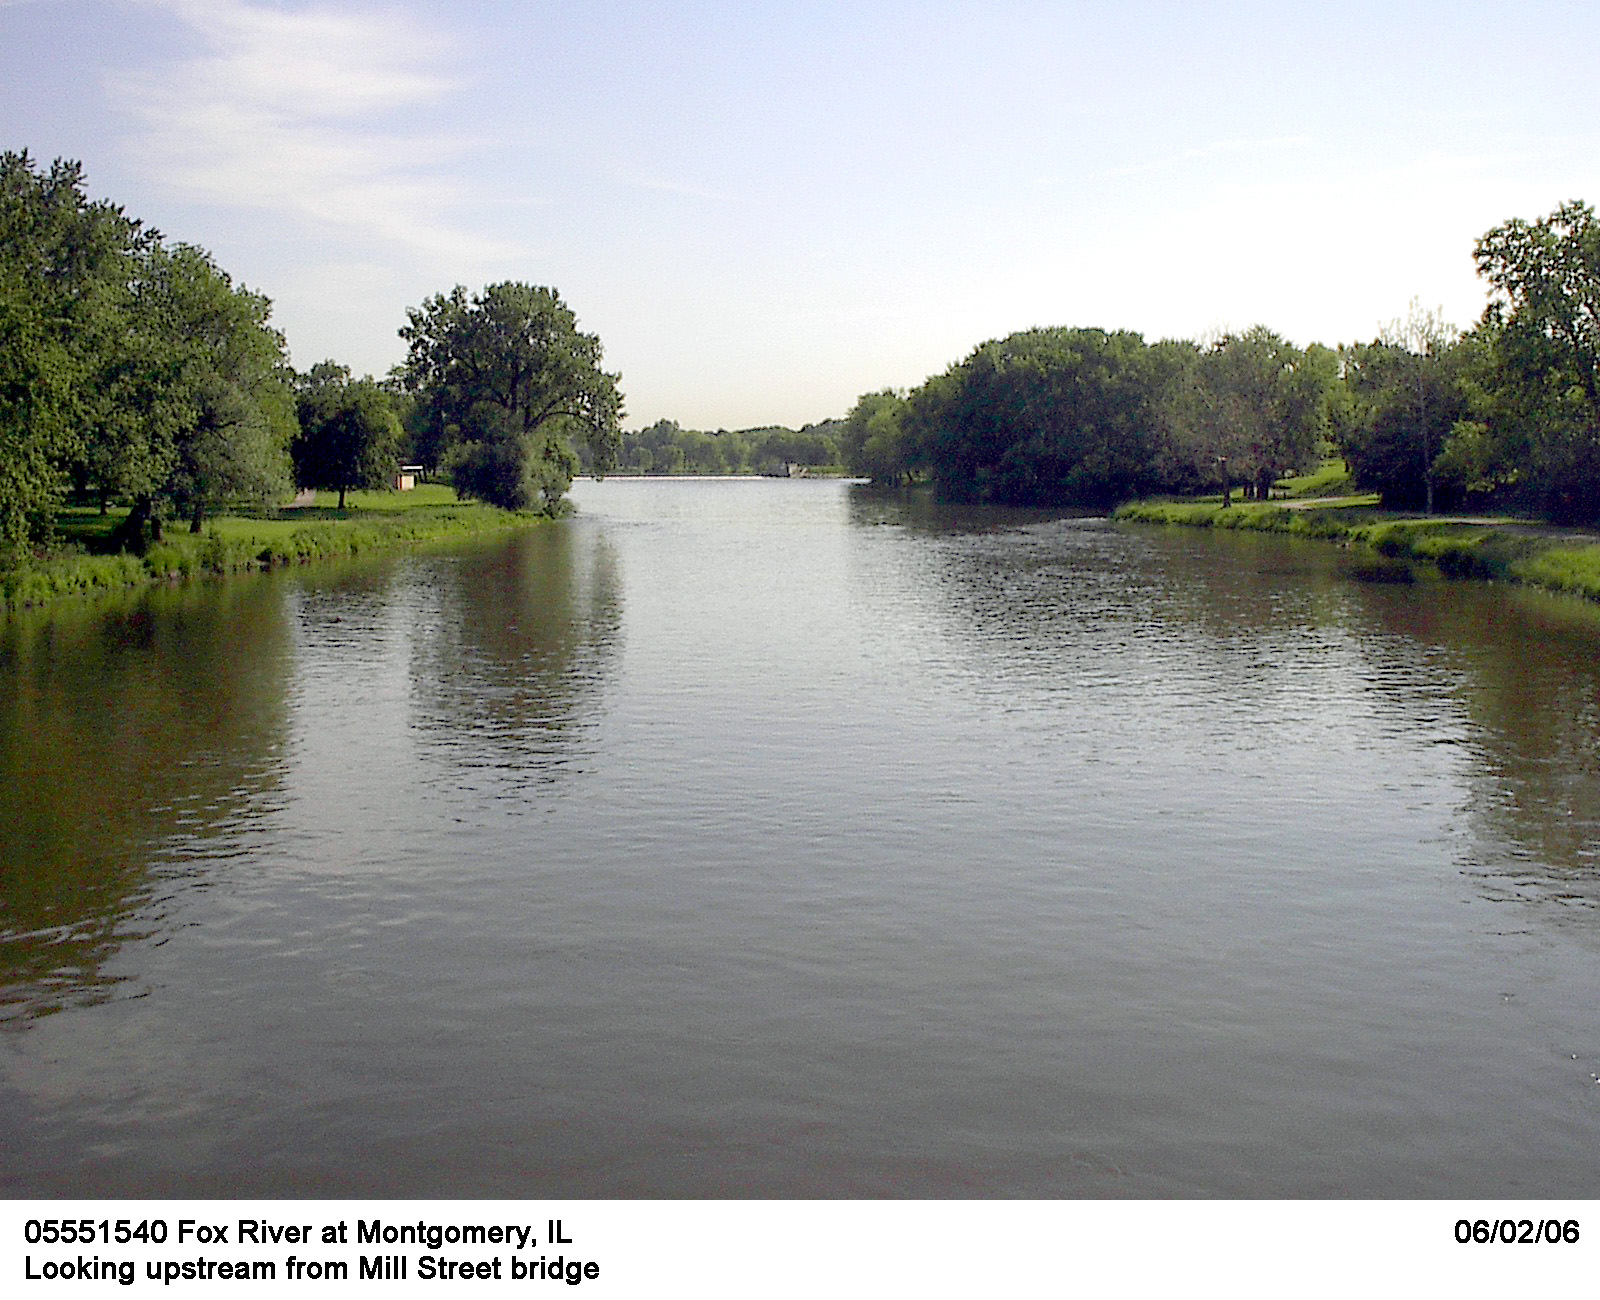
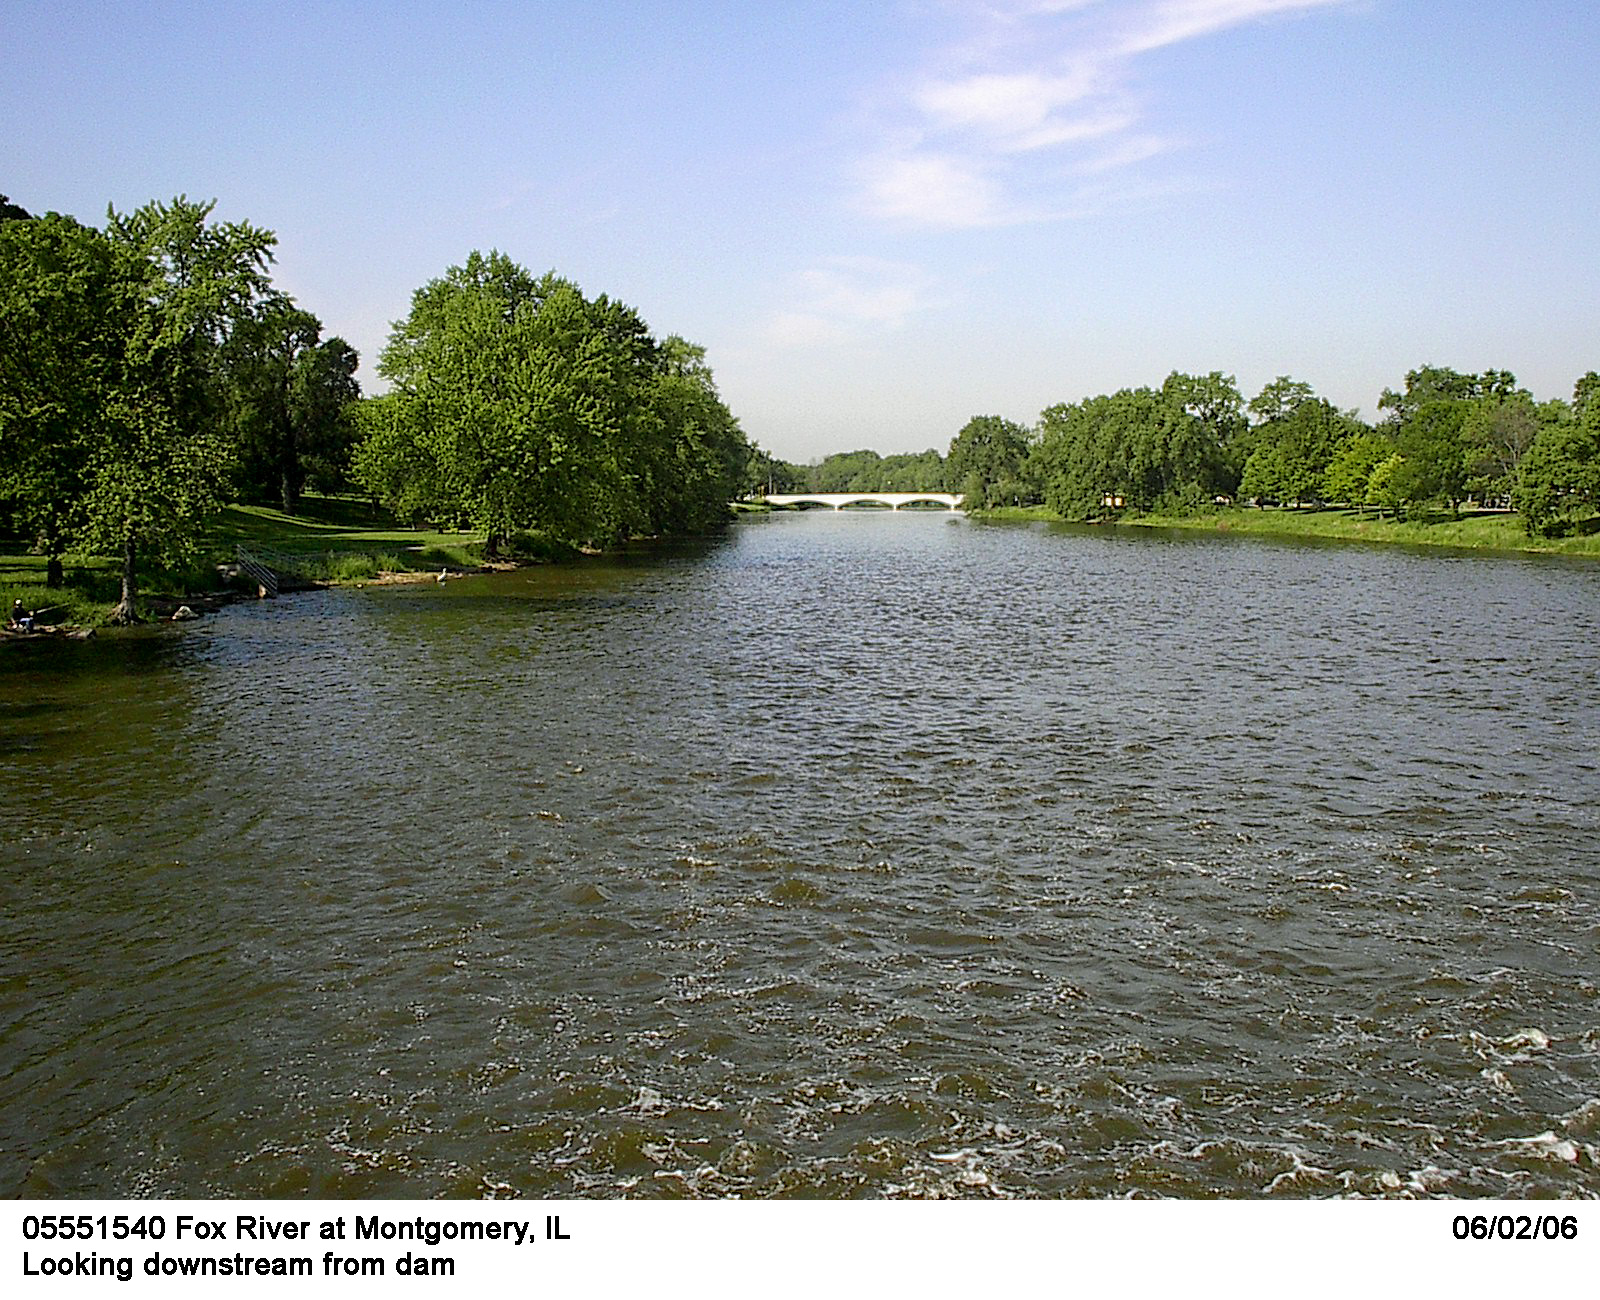
Description of Channel.--This channel is straight and natural with cross sections generally in wide, rectangular shapes. Bed materials consist of mixtures of sand, gravel, medium to large cobbles, and small scattered boulders. The bottom width of the channel is approximately 250 ft. Bank materials for stages below bank points are primarily gravel and coarse-sand mixtures. Above the bank points, flood plains are predominantly weeds and tall grass with sparse mature trees. Bank heights vary between 5 to 10 ft, and top width is about 300 ft.
Floods.-- Maximum discharge since Oct 2002 was 18,000 ft3/s, September 14, 2008, gage height 15.12 ft.

![]() U.S. Department of the Interior |
U.S. Geological Survey
U.S. Department of the Interior |
U.S. Geological Survey
URL: http://il.water.usgs.gov/proj/nvalues/db/sites/05551540.shtml[an error occurred while processing this directive]?
Page Contact Information: David Soong
Page Last Modified: February 4, 2013
