

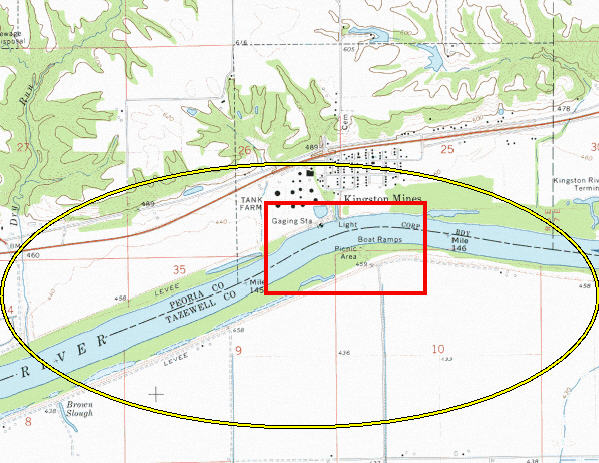
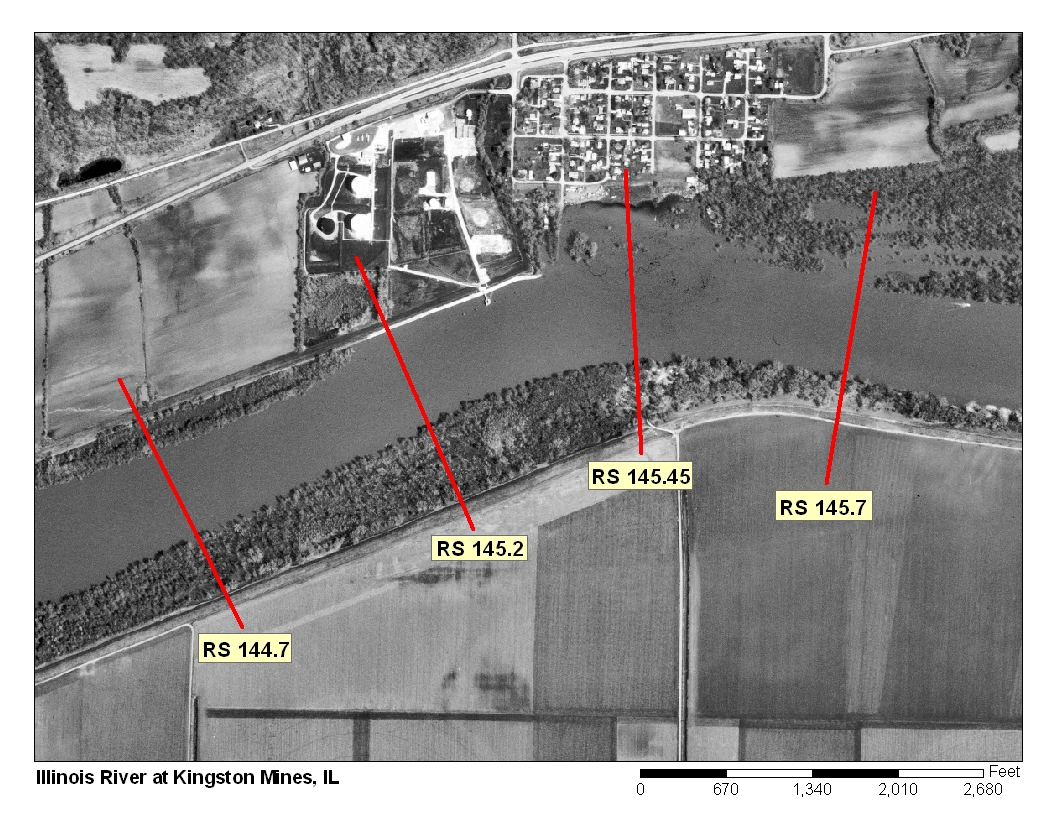
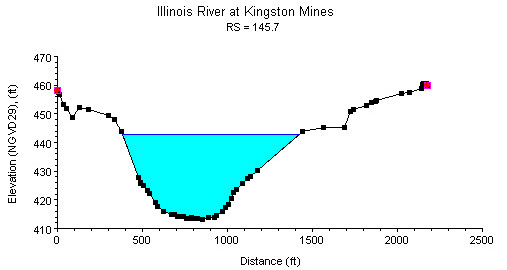
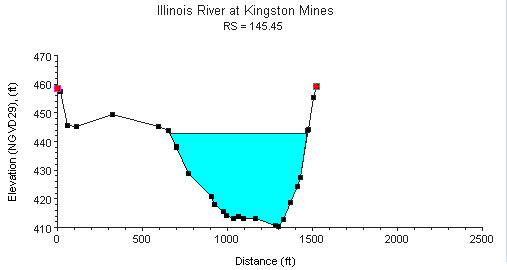
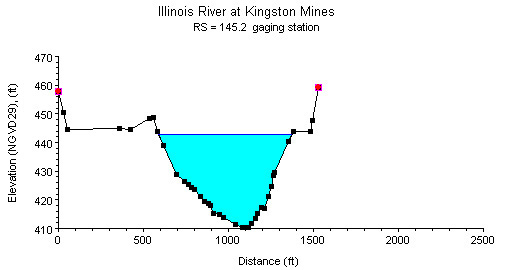
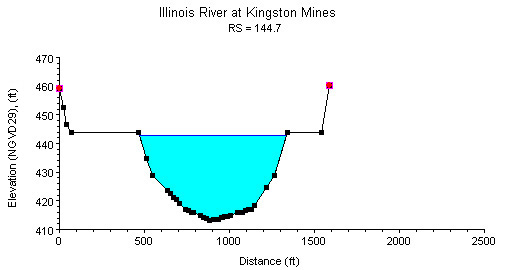
Study Reach.--The channel reach is free-flowing in the upper part of a navigation pool (the La Grange Pool on the Illinois River in this case). The study reach is a relatively straight channel (approximately 5,820 ft long) and is represented by the channel segment centered on the USGS streamflow gage at Kingston Mines, as shown in the quadrangle map on the top left. Eleven cross sections (surveyed by the U.S. Army Corps of Engineers, in August 1998) are available for describing the channel geometry and its variation in the channel segment. The channel alignment, approximate variations in channel width and bank conditions, and locations of cross sections in the study reach are shown in the aerial photograph on the top-right. Four cross sections, as shown in the cross-sectional plots above and centered on the USGS gage, are used to represent geometries in the study reach.
Gage Location.--Lat 40°33'11", long 89°46'38", in SE1/4 SE1/4 sec.26, T.7N., R.6E., Peoria County, Hydrologic Unit 07130003, on the right bank at Kingston Mines, 2.3 mi downstream from the Mackinaw River and at river mi 145.4. The USGS streamgage station number is 05568500.
Drainage Area.--15,818 sq mi.
Gage Datum and Elevations of Reference Points.--This is a slope station site. Datum of the base gage at Kingston Mines is 428.00 ft. The auxiliary gage is located at the Illinois River at Copperas Creek, 8.6 miles downstream. All elevations are referenced to NGVD29.
Stage, Discharge Measurements, and Computed n-Values.--Since 1993, discharge measurements have been made with an Acoustic Doppler Current Profiler (ADCP) by boat near the base (Kingston Mines) gage or near the auxiliary gage for most stages. Events for the n-value study were selected from actual ADCP measurements, for which flow was confined to the main channel (stage readings at both gages were below 19 ft). Water-surface slope for each selected event was determined by taking the difference in water surface elevations between the base and auxiliary gages at the time of the discharge measurement and dividing by the distance. The computed n-values are listed in the following table. Whenever possible, the computed n-values are associated with a photograph taken at the time of the measurement. The photographs are arranged from low to high discharge in order to illustrate the contributing factors of n-values at a particular discharge.
| Date of Observation | Discharge (ft3/s) | Average Cross Section Area (ft2) | Hydraulic Radius (ft) | Mean Velocity (ft/s) | Slope (ft/ft) | Coefficient of Roughness n |
|---|---|---|---|---|---|---|
| 10/23/2002 | 4090.0 | 8048.3 | 12.04 | 0.51 | 0.000003 | 0.019 |
| 7/31/2002 | 6220.0 | 8738.3 | 12.79 | 0.72 | 0.000004 | 0.017 |
| 1/9/1997 | 13600.0 | 11632.8 | 15.67 | 1.18 | 0.000013 | 0.021 |
| 5/9/1997 | 15500.0 | 12324.7 | 16.31 | 1.27 | 0.000013 | 0.020 |
| 6/13/2000 | 19500.0 | 13526.2 | 17.39 | 1.45 | 0.000010 | 0.016 |
| 4/3/2002 | 19600.0 | 14199.5 | 17.97 | 1.39 | 0.000013 | 0.020 |
| 8/11/1981 | 24200.0 | 17312.9 | 20.49 | 1.41 | 0.000010 | 0.019 |
| 5/22/1979 | 25700.0 | 17099.6 | 20.33 | 1.51 | 0.000013 | 0.020 |
| 12/19/1990 | 25800.0 | 17028.2 | 20.28 | 1.52 | 0.000018 | 0.023 |
| 6/24/1998 | 27300.0 | 18841.2 | 17.28 | 1.46 | 0.000011 | 0.020 |
| 5/21/1991 | 28500.0 | 17181.3 | 20.39 | 1.67 | 0.000017 | 0.021 |
| 10/24/2001 | 28800.0 | 15897.4 | 19.38 | 1.82 | 0.000013 | 0.016 |
| 4/11/1984 | 29400.0 | 18365.3 | 19.54 | 1.61 | 0.000016 | 0.021 |
| 3/29/1978 | 31300.0 | 18015.8 | 20.98 | 1.75 | 0.000018 | 0.029 |
| 11/18/1992 | 32000.0 | 17234.2 | 20.42 | 1.87 | 0.000019 | 0.019 |
| 4/16/1991 | 33200.0 | 17459.7 | 20.58 | 1.91 | 0.000023 | 0.021 |
| 1/13/1998 | 33700.0 | 17600.8 | 20.68 | 1.92 | 0.000022 | 0.020 |
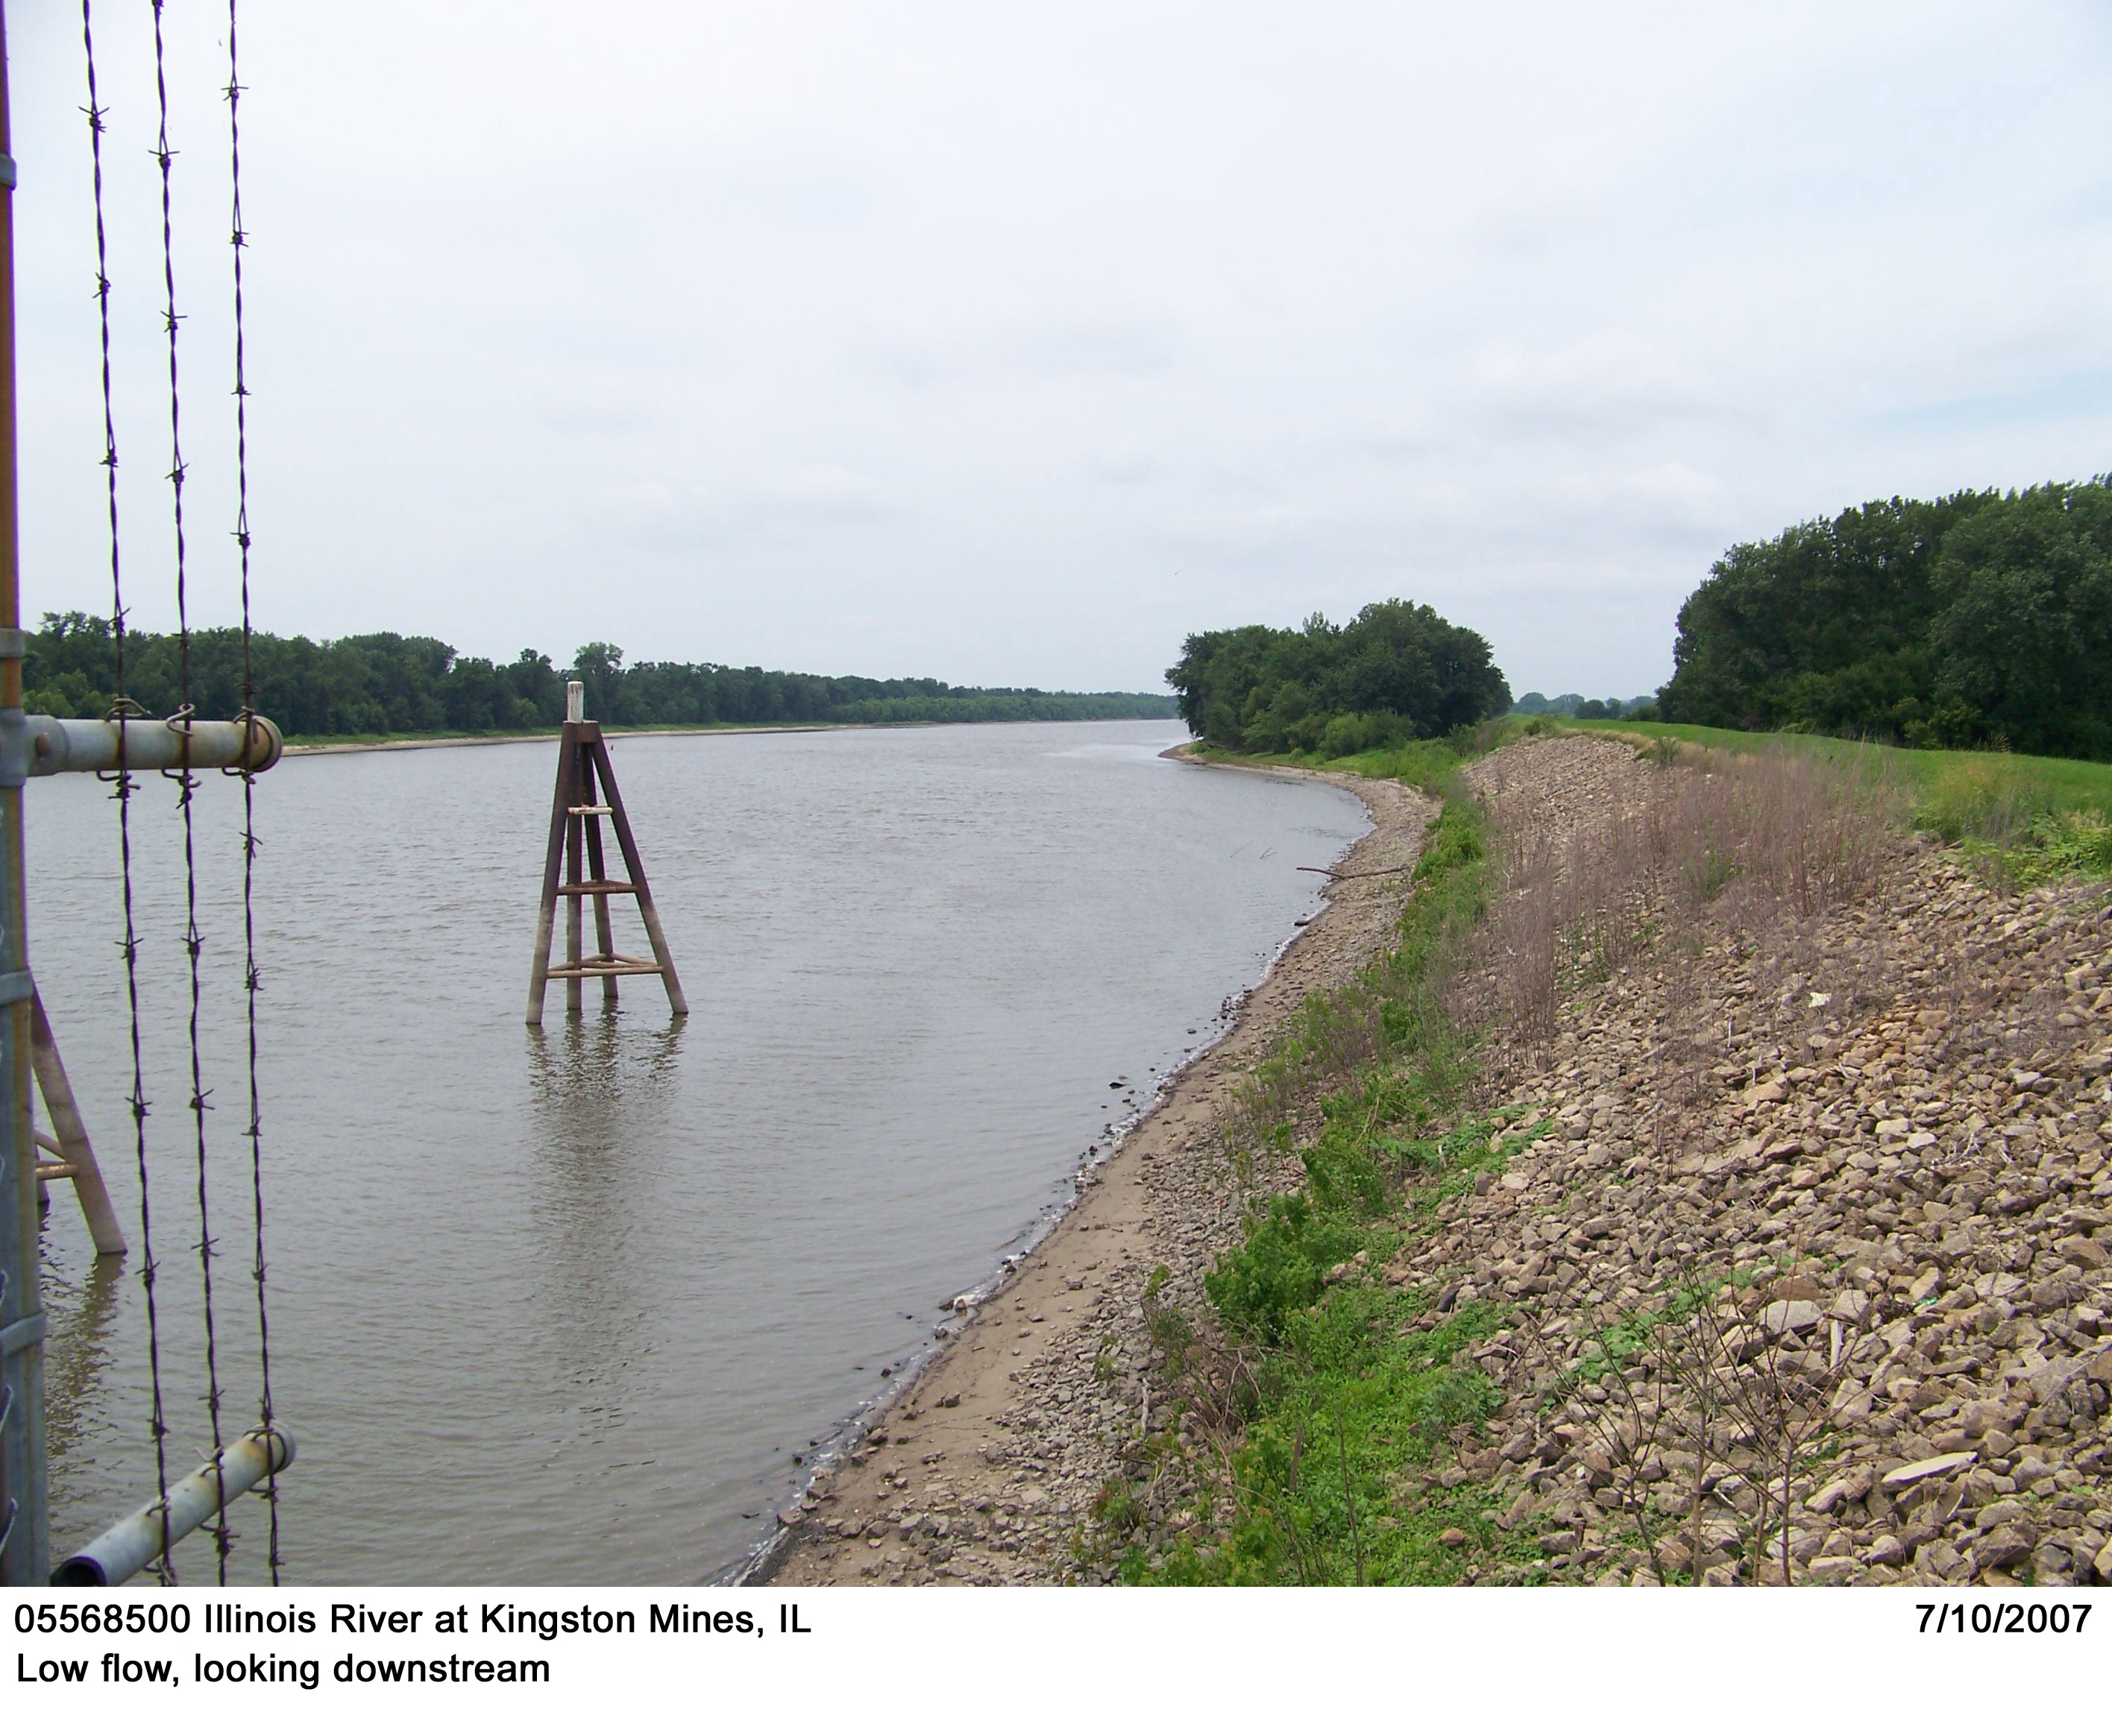
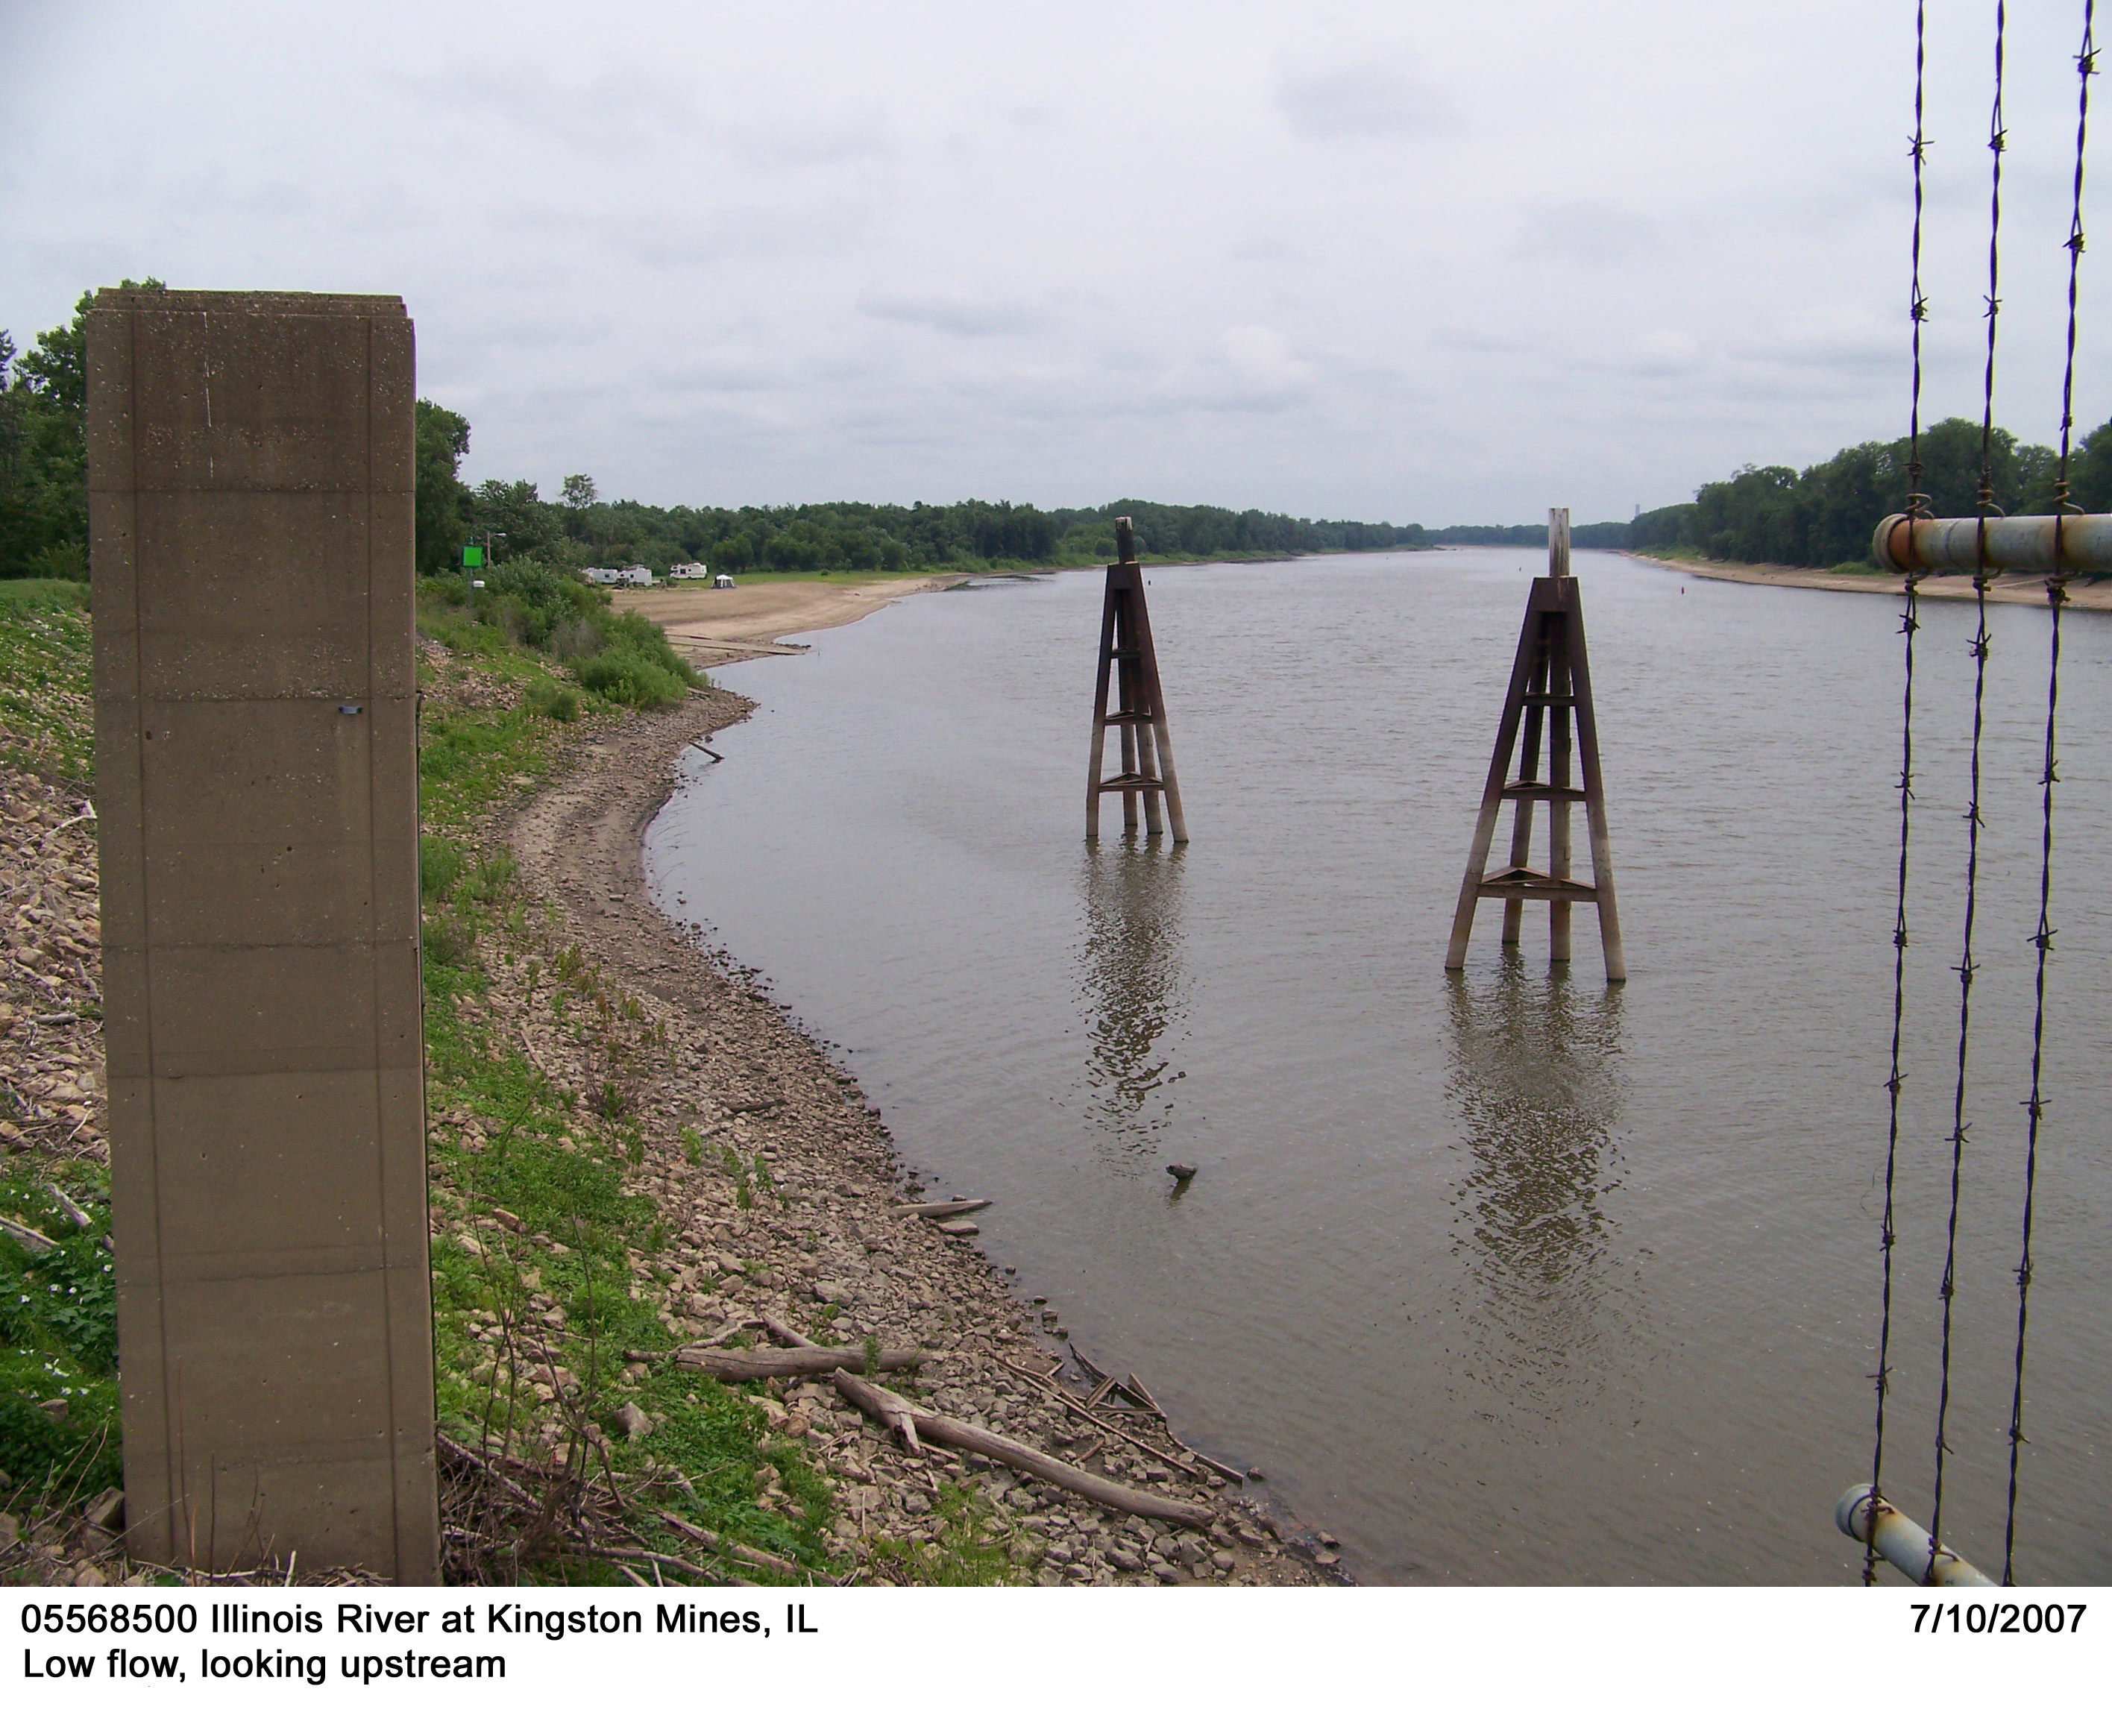
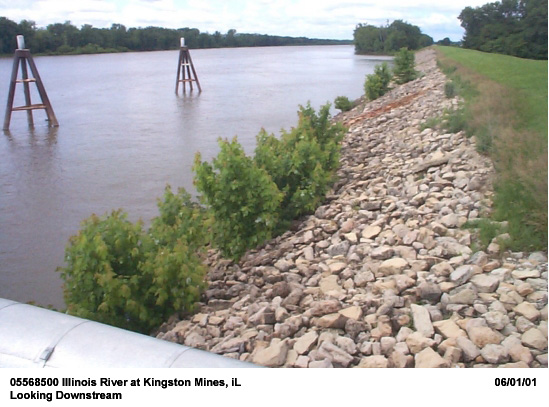
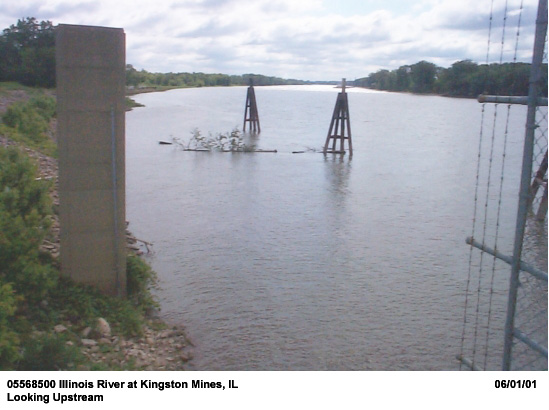
Description of Channel.--This is a natural, straight channel in the free-flowing (upper) reach of a navigation pool. Bed materials consist of soft sand and a mixture of silts and clays. Both banks are protected with riprap that consists of large cobbles, as shown in channel photographs above. Seasonal seedlings grow sparsely above the normal water edge. The overall cross section consists of a main channel and flood plains on both sides. The main channel is wide and semi-circular with main channel width at bank points level approximately 820 ft and average depth to the top of the banks is around 30 ft. The flood plains are restricted by levees.
Floods.-- Maximum discharge, 101,000 ft3/s (estimated based on graphic reconstruction), Sept. 20, 2008, gage height, 24.68 ft; maximum gage height, 26.02 ft., May 25, 1943.

![]() U.S. Department of the Interior |
U.S. Geological Survey
U.S. Department of the Interior |
U.S. Geological Survey
URL: http://il.water.usgs.gov/proj/nvalues/db/sites/05568500.shtml[an error occurred while processing this directive]?
Page Contact Information: David Soong
Page Last Modified: February 4, 2013
