

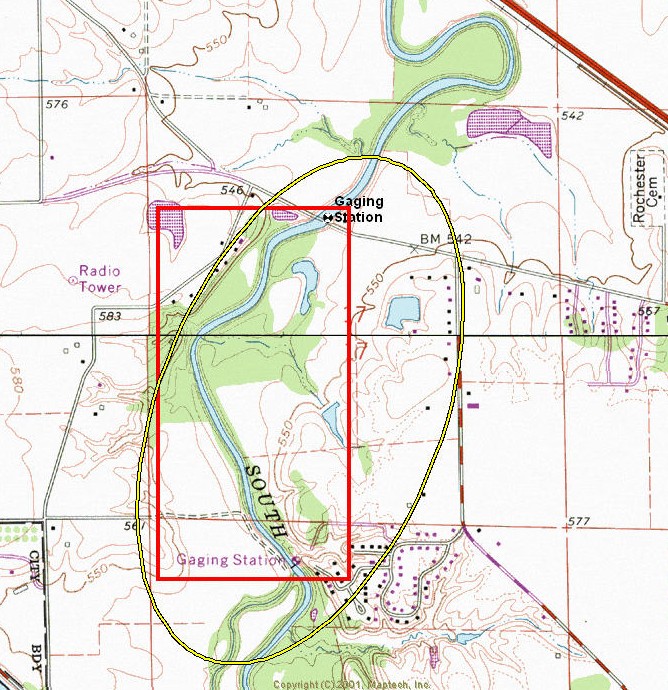
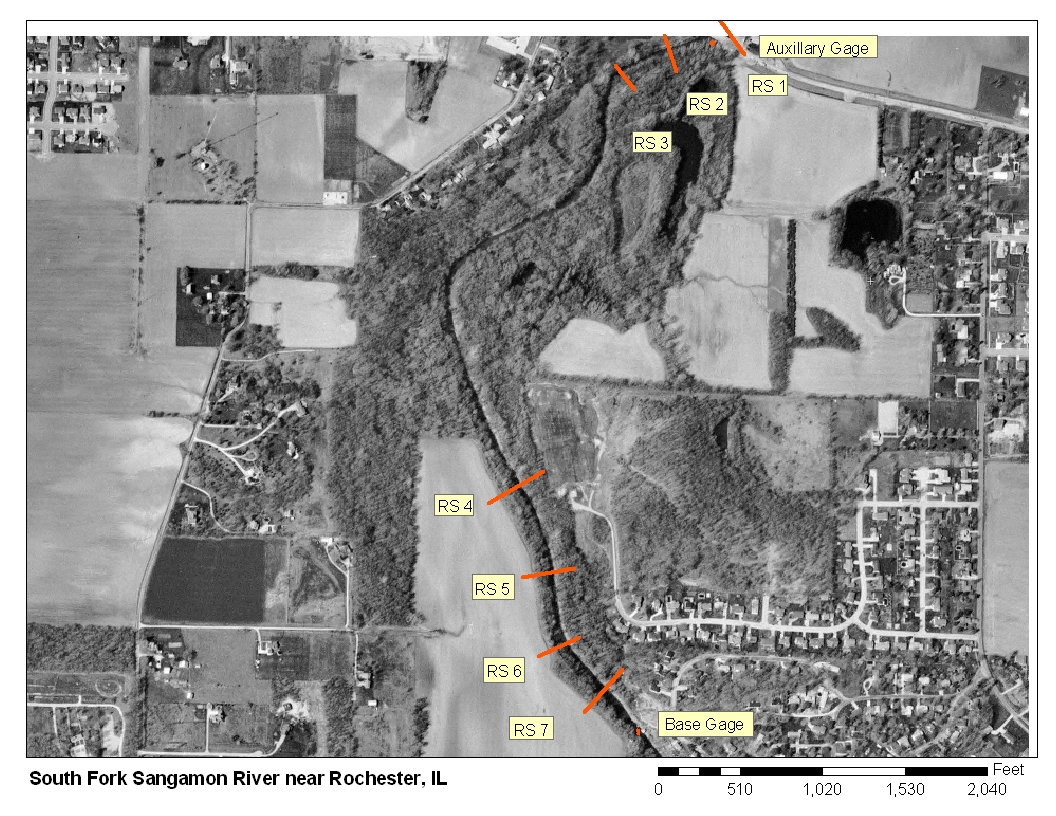
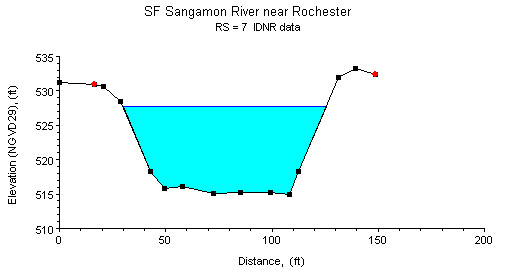
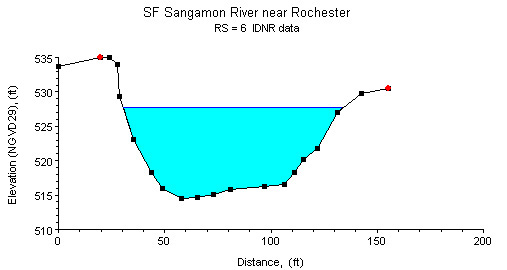
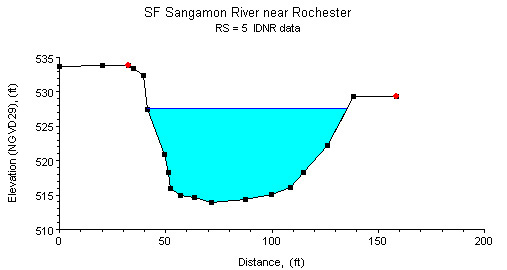
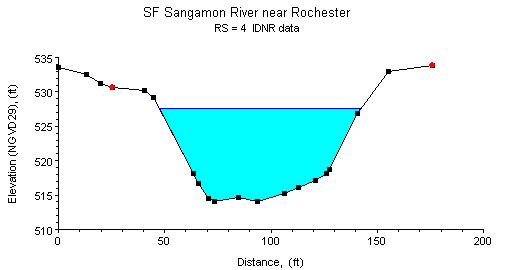
Study Reach.--The channel reach is the meandering reach of a natural channel. The study reach, approximately 5,540 ft long, is located from Penacook Drive (upstream) to the West Main Street bridge (downstream), as shown in the quadrangle map on the top left. Seven surveyed cross sections (surveyed by the Illinois Department of Natural Resources in January and February 2004) are available for describing channel geometries in the study reach. The channel alignment, approximate variations in channel width and bank conditions, and locations of the surveyed cross sections are shown in the aerial photograph on the top right. Cross sections at river stations (RS) 7, 6, 5, and 4 are plotted above.
Gage Location.--Lat 39°44'32", long 89°34'02", in NE1/4 NW1/4 sec.20, T.15N., R.4W., Sangamon County, Hydrologic Unit 07130007, on the right bank at the city of Springfield dam, 100 ft downstream from Horse Creek, 1.7 mi southwest of Rochester, and at river mi 7.4. The auxiliary gage is located at lat 39(45' 14", long 89(33' 56", in NE1/4NW1/4 sec.17, T.15 N., R.4 W., Sangamon County, Hydrologic Unit 07130007, on the right bank, 1.3 mi downstream from Horse Creek, 1.5 mi west of Rochester. The USGS streamgage station number for the base gage is 05576000.
Drainage Area.--867 sq mi.
Gage Datum and Elevations of Reference Points.--This is a slope station site where the auxiliary gage is located 1.3 mi downstream from the base station on the upstream side of the bridge on West Main Street. Datum of both the base and the auxiliary gage is 511.30 ft. A wire-weight gage (WWG) is mounted on the handrail of the pump house platform at the base gage, and a WWG is attached to the upstream side of the West Main Street bridge at the auxiliary gage. All elevations are referenced to NGVD29.
Stage, Discharge Measurements, and Computed n-Values.--Stage and discharge data suitable for n-value analysis were retrieved from measured discharge and corresponding water-surface elevations at the base and auxiliary gages. Discharge measurements were made using the conventional current-meter method. Discharges corresponding to a stage above 15 ft at the auxiliary gage were not used because of concerns over varying degrees of backwater effects, caused by the combination of the bridge opening at the auxiliary gage, the flood plains downstream and at the gage, and low water-surface slopes. Only in-channel flows were selected for the present study. The computed n-values are listed in the following table. Whenever possible, the computed n-values are associated with a photograph taken at the time of the measurement. The photographs are arranged from low to high discharge in order to illustrate the contributing factors of n-values at a particular discharge.
| Date of Observation | Discharge (ft3/s) | Average Cross Section Area (ft2) | Hydraulic Radius (ft) | Mean Velocity (ft/s) | Slope (ft/ft) | Coefficient of Roughness n |
|---|---|---|---|---|---|---|
| 3/25/2003 | 123.0 | 191.7 | 2.87 | 0.65 | 0.000091 | 0.042 |
| 12/17/2003 | 229.0 | 275.3 | 3.78 | 0.84 | 0.000099 | 0.041 |
| 10/22/2001 | 252.0 | 279.7 | 3.83 | 0.91 | 0.000100 | 0.039 |
| 4/5/2001 | 269.0 | 309.4 | 4.14 | 0.88 | 0.000099 | 0.042 |
| 1/16/2002 | 291.0 | 269.9 | 3.72 | 1.09 | 0.000110 | 0.033 |
| 3/8/1999 | 342.0 | 385.9 | 4.87 | 0.90 | 0.000084 | 0.042 |
| 4/1/1997 | 367.0 | 356.8 | 4.60 | 1.04 | 0.000090 | 0.036 |
| 3/26/1996 | 575.0 | 414.9 | 5.13 | 1.40 | 0.000122 | 0.033 |
| 2/19/1998 | 603.0 | 481.8 | 5.71 | 1.26 | 0.000079 | 0.032 |
| 4/19/1995 | 756.0 | 540.9 | 6.20 | 1.41 | 0.000106 | 0.035 |
| 2/13/2002 | 805.0 | 516.6 | 6.01 | 1.57 | 0.000115 | 0.032 |
| 8/19/1998 | 851.0 | 588.1 | 6.59 | 1.46 | 0.000110 | 0.036 |
| 6/28/2002 | 871.0 | 559.8 | 6.36 | 1.57 | 0.000121 | 0.034 |
| 5/10/1999 | 1170.0 | 725.1 | 7.61 | 1.63 | 0.000120 | 0.037 |
| 6/15/1994 | 1470.0 | 788.7 | 8.05 | 1.88 | 0.000100 | 0.030 |
| 6/11/1993 | 1800.0 | 928.6 | 8.92 | 1.96 | 0.000102 | 0.032 |
| 5/12/1995 | 2010.0 | 1083.7 | 9.61 | 1.88 | 0.000095 | 0.034 |
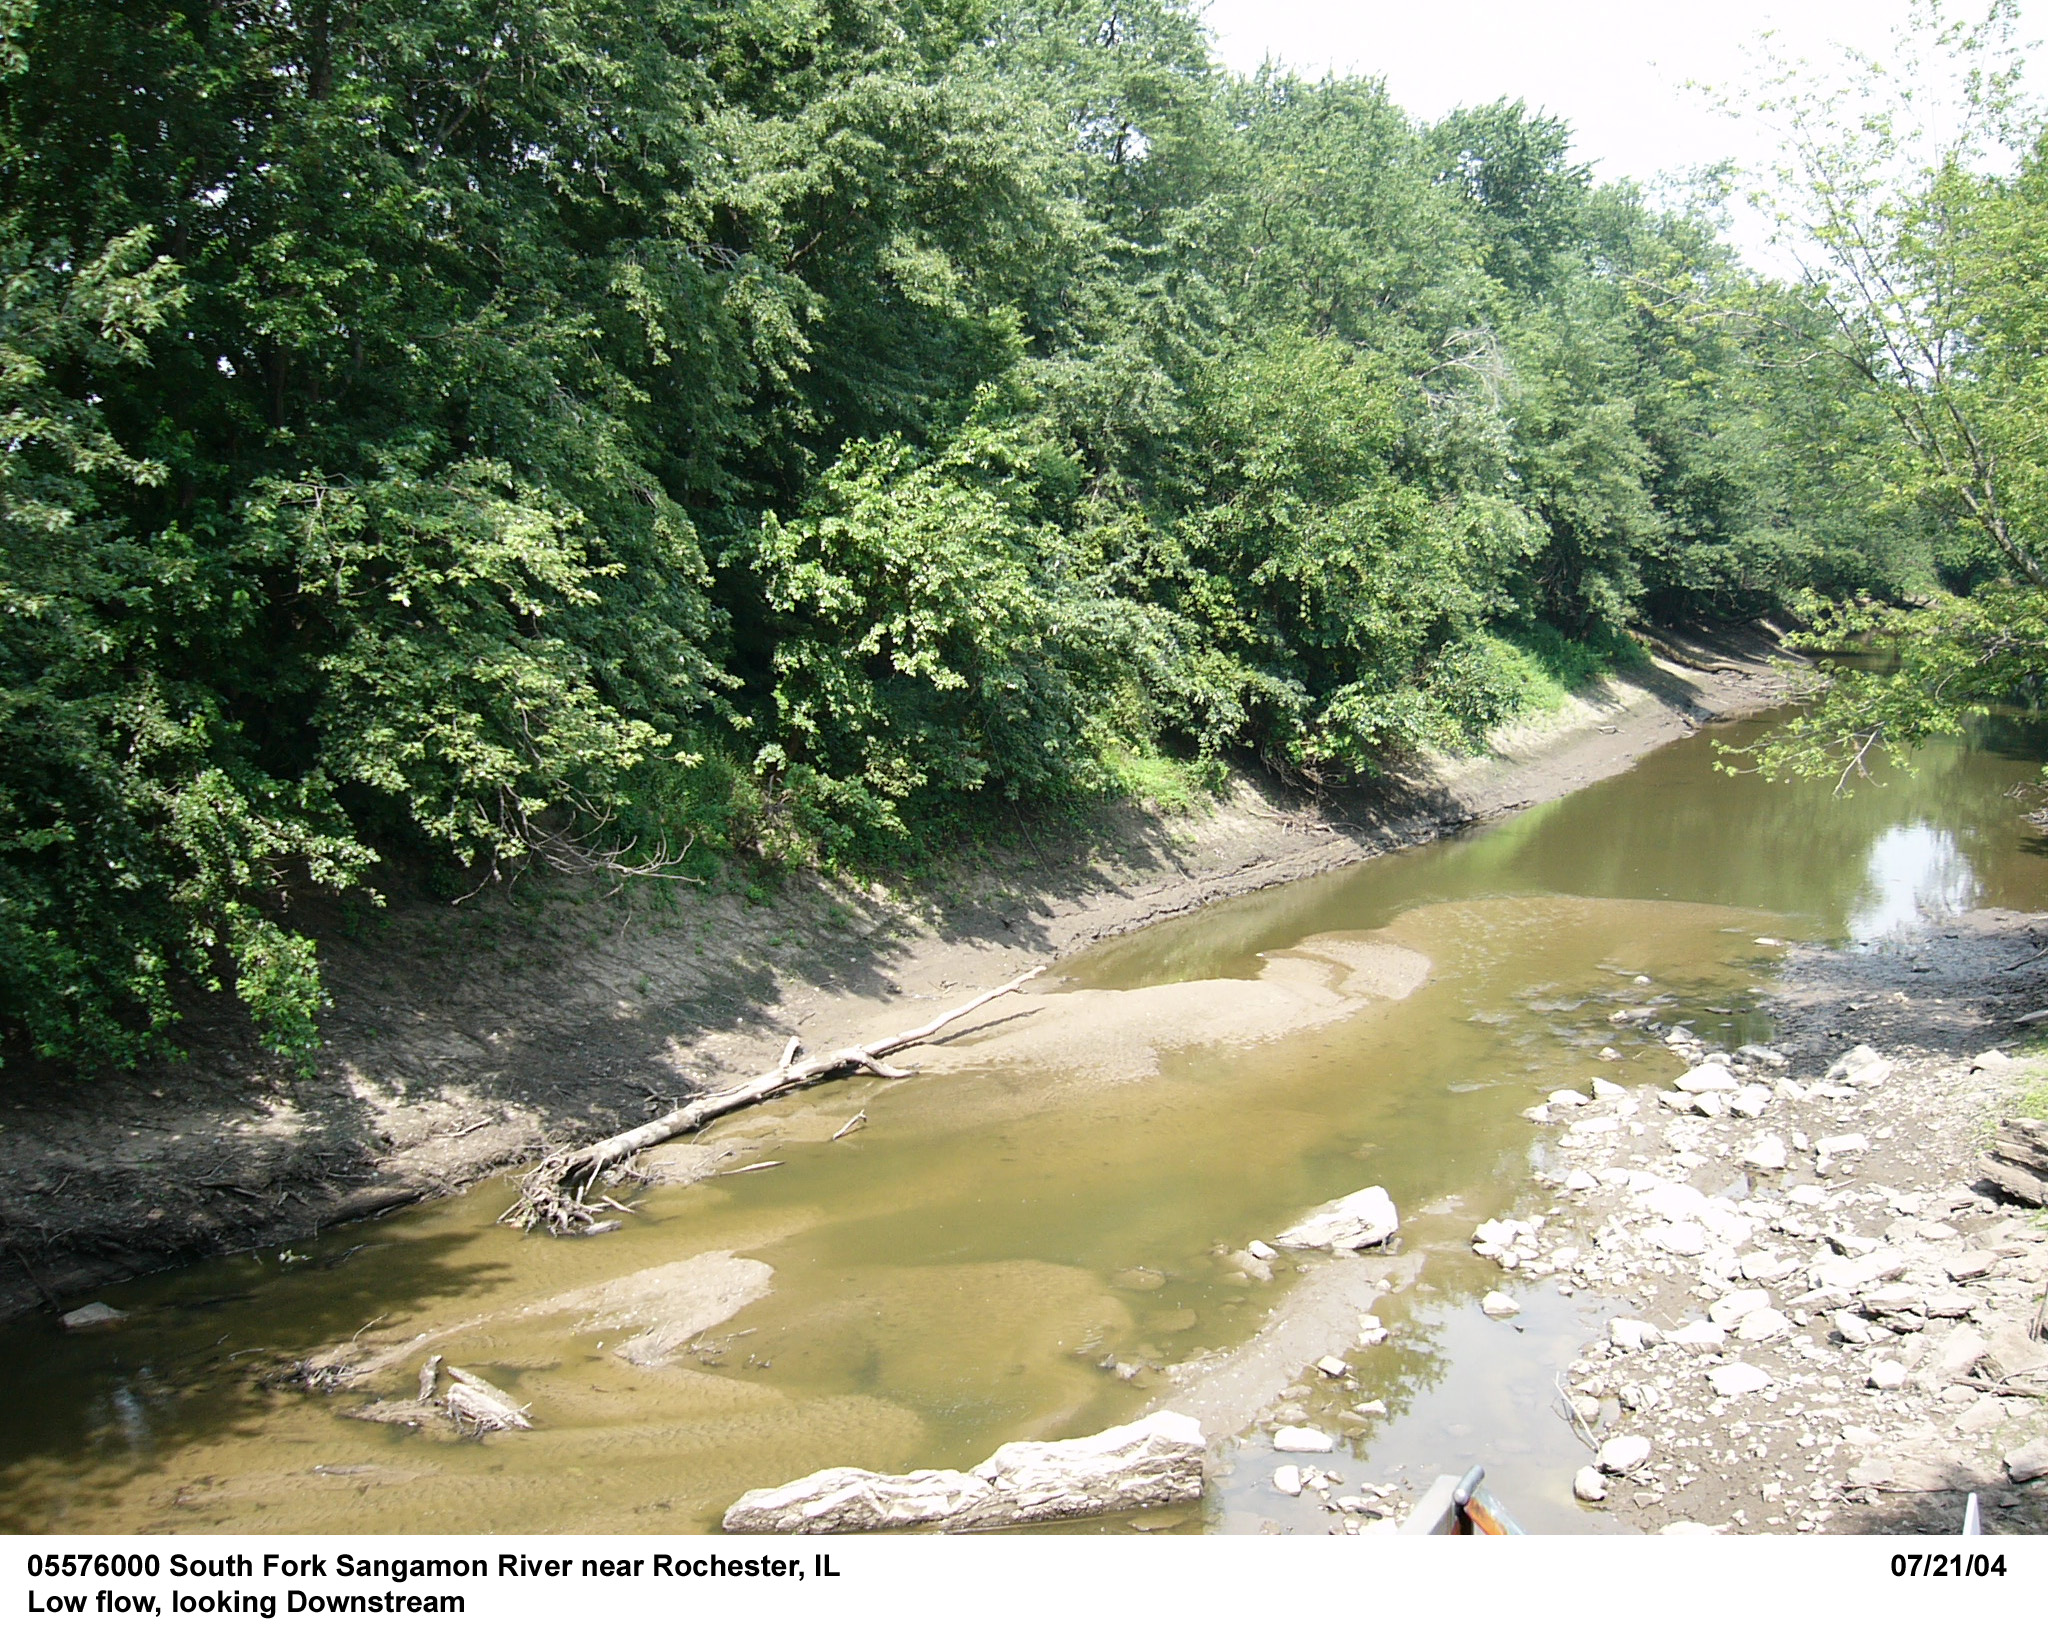
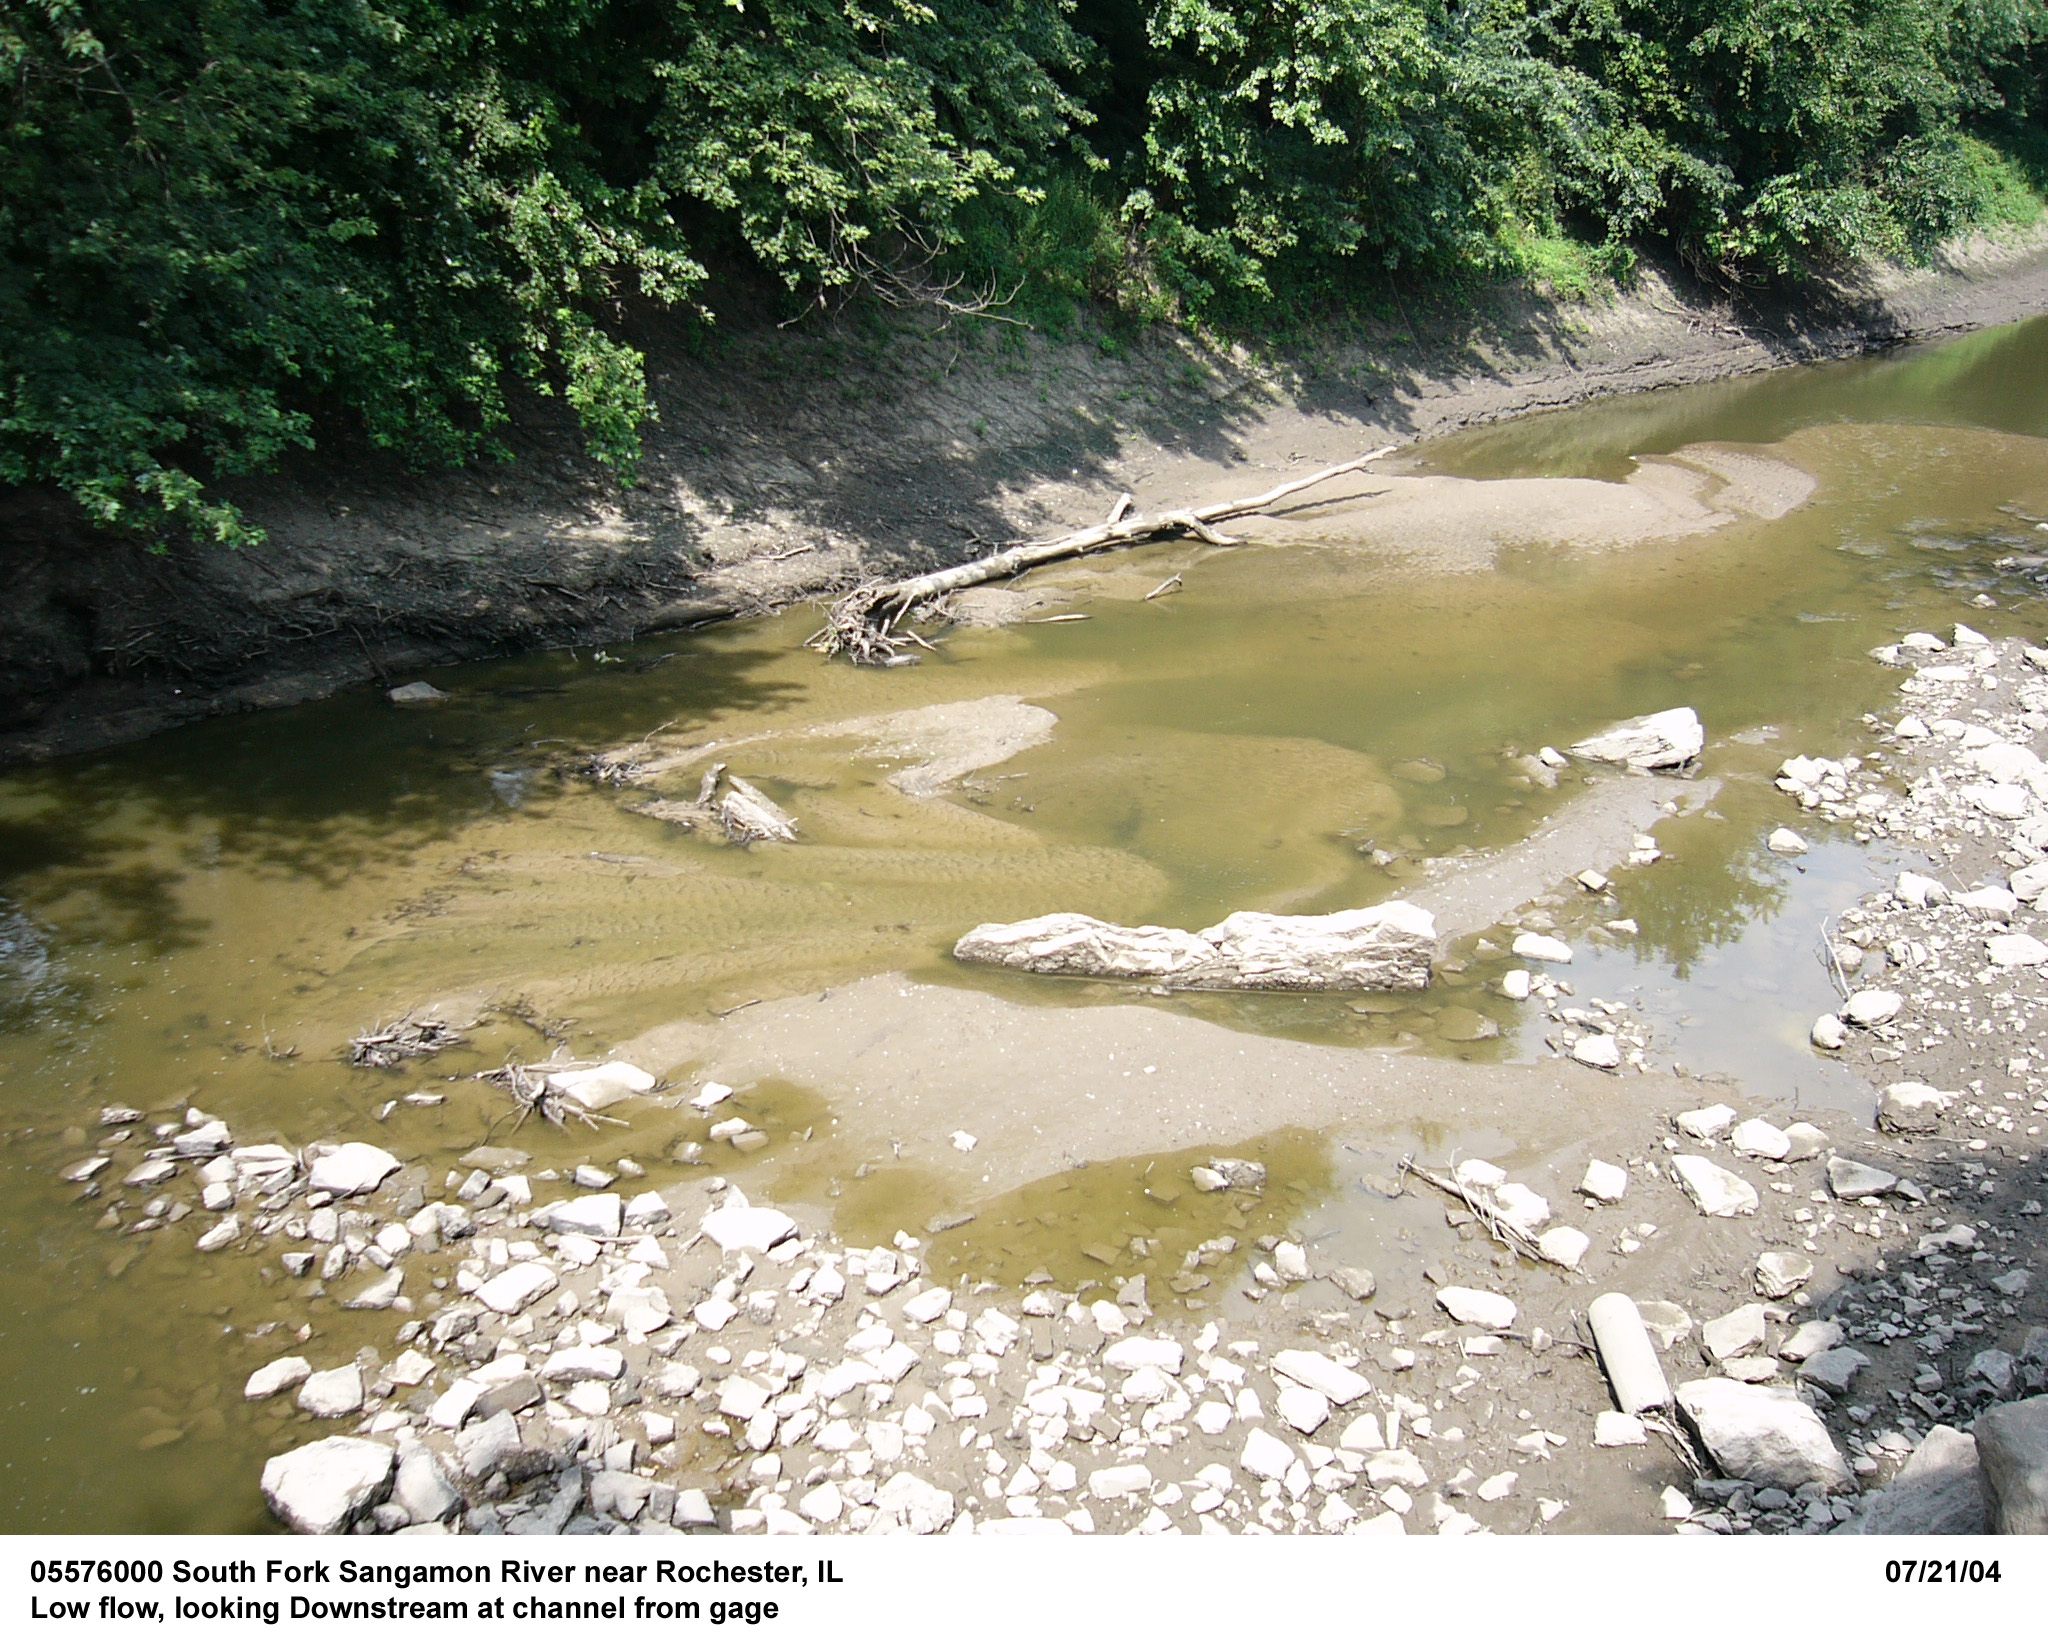
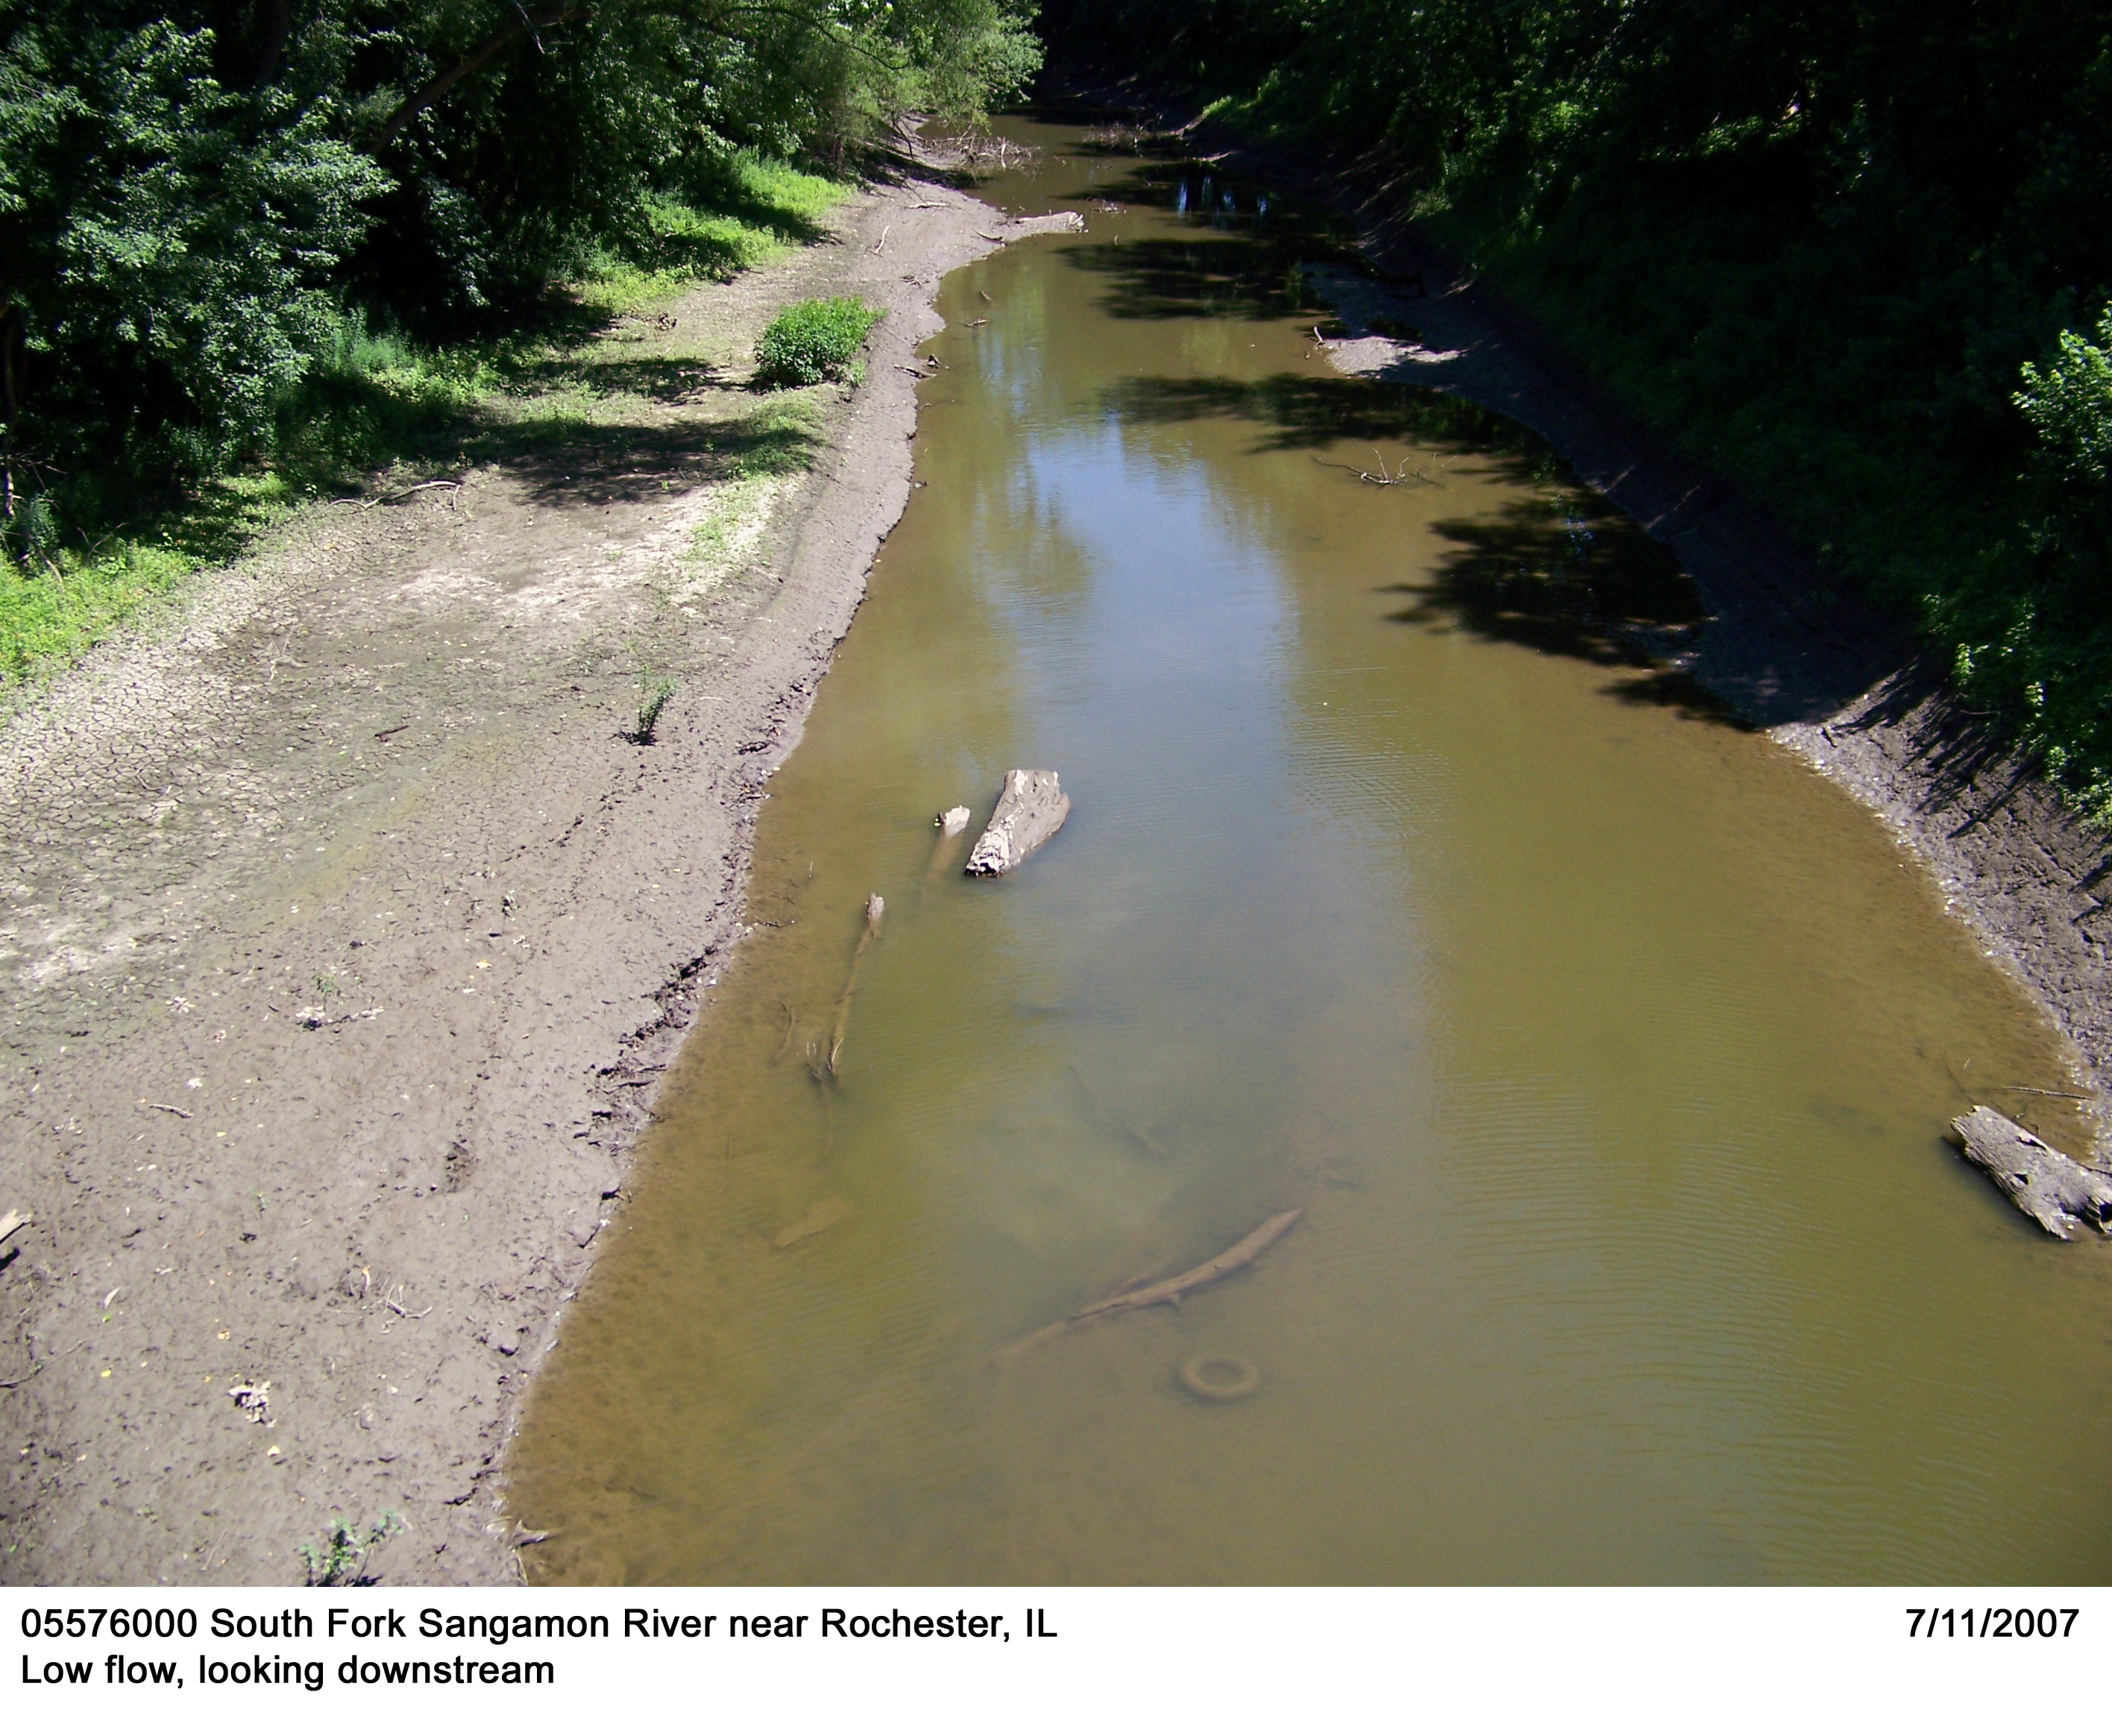
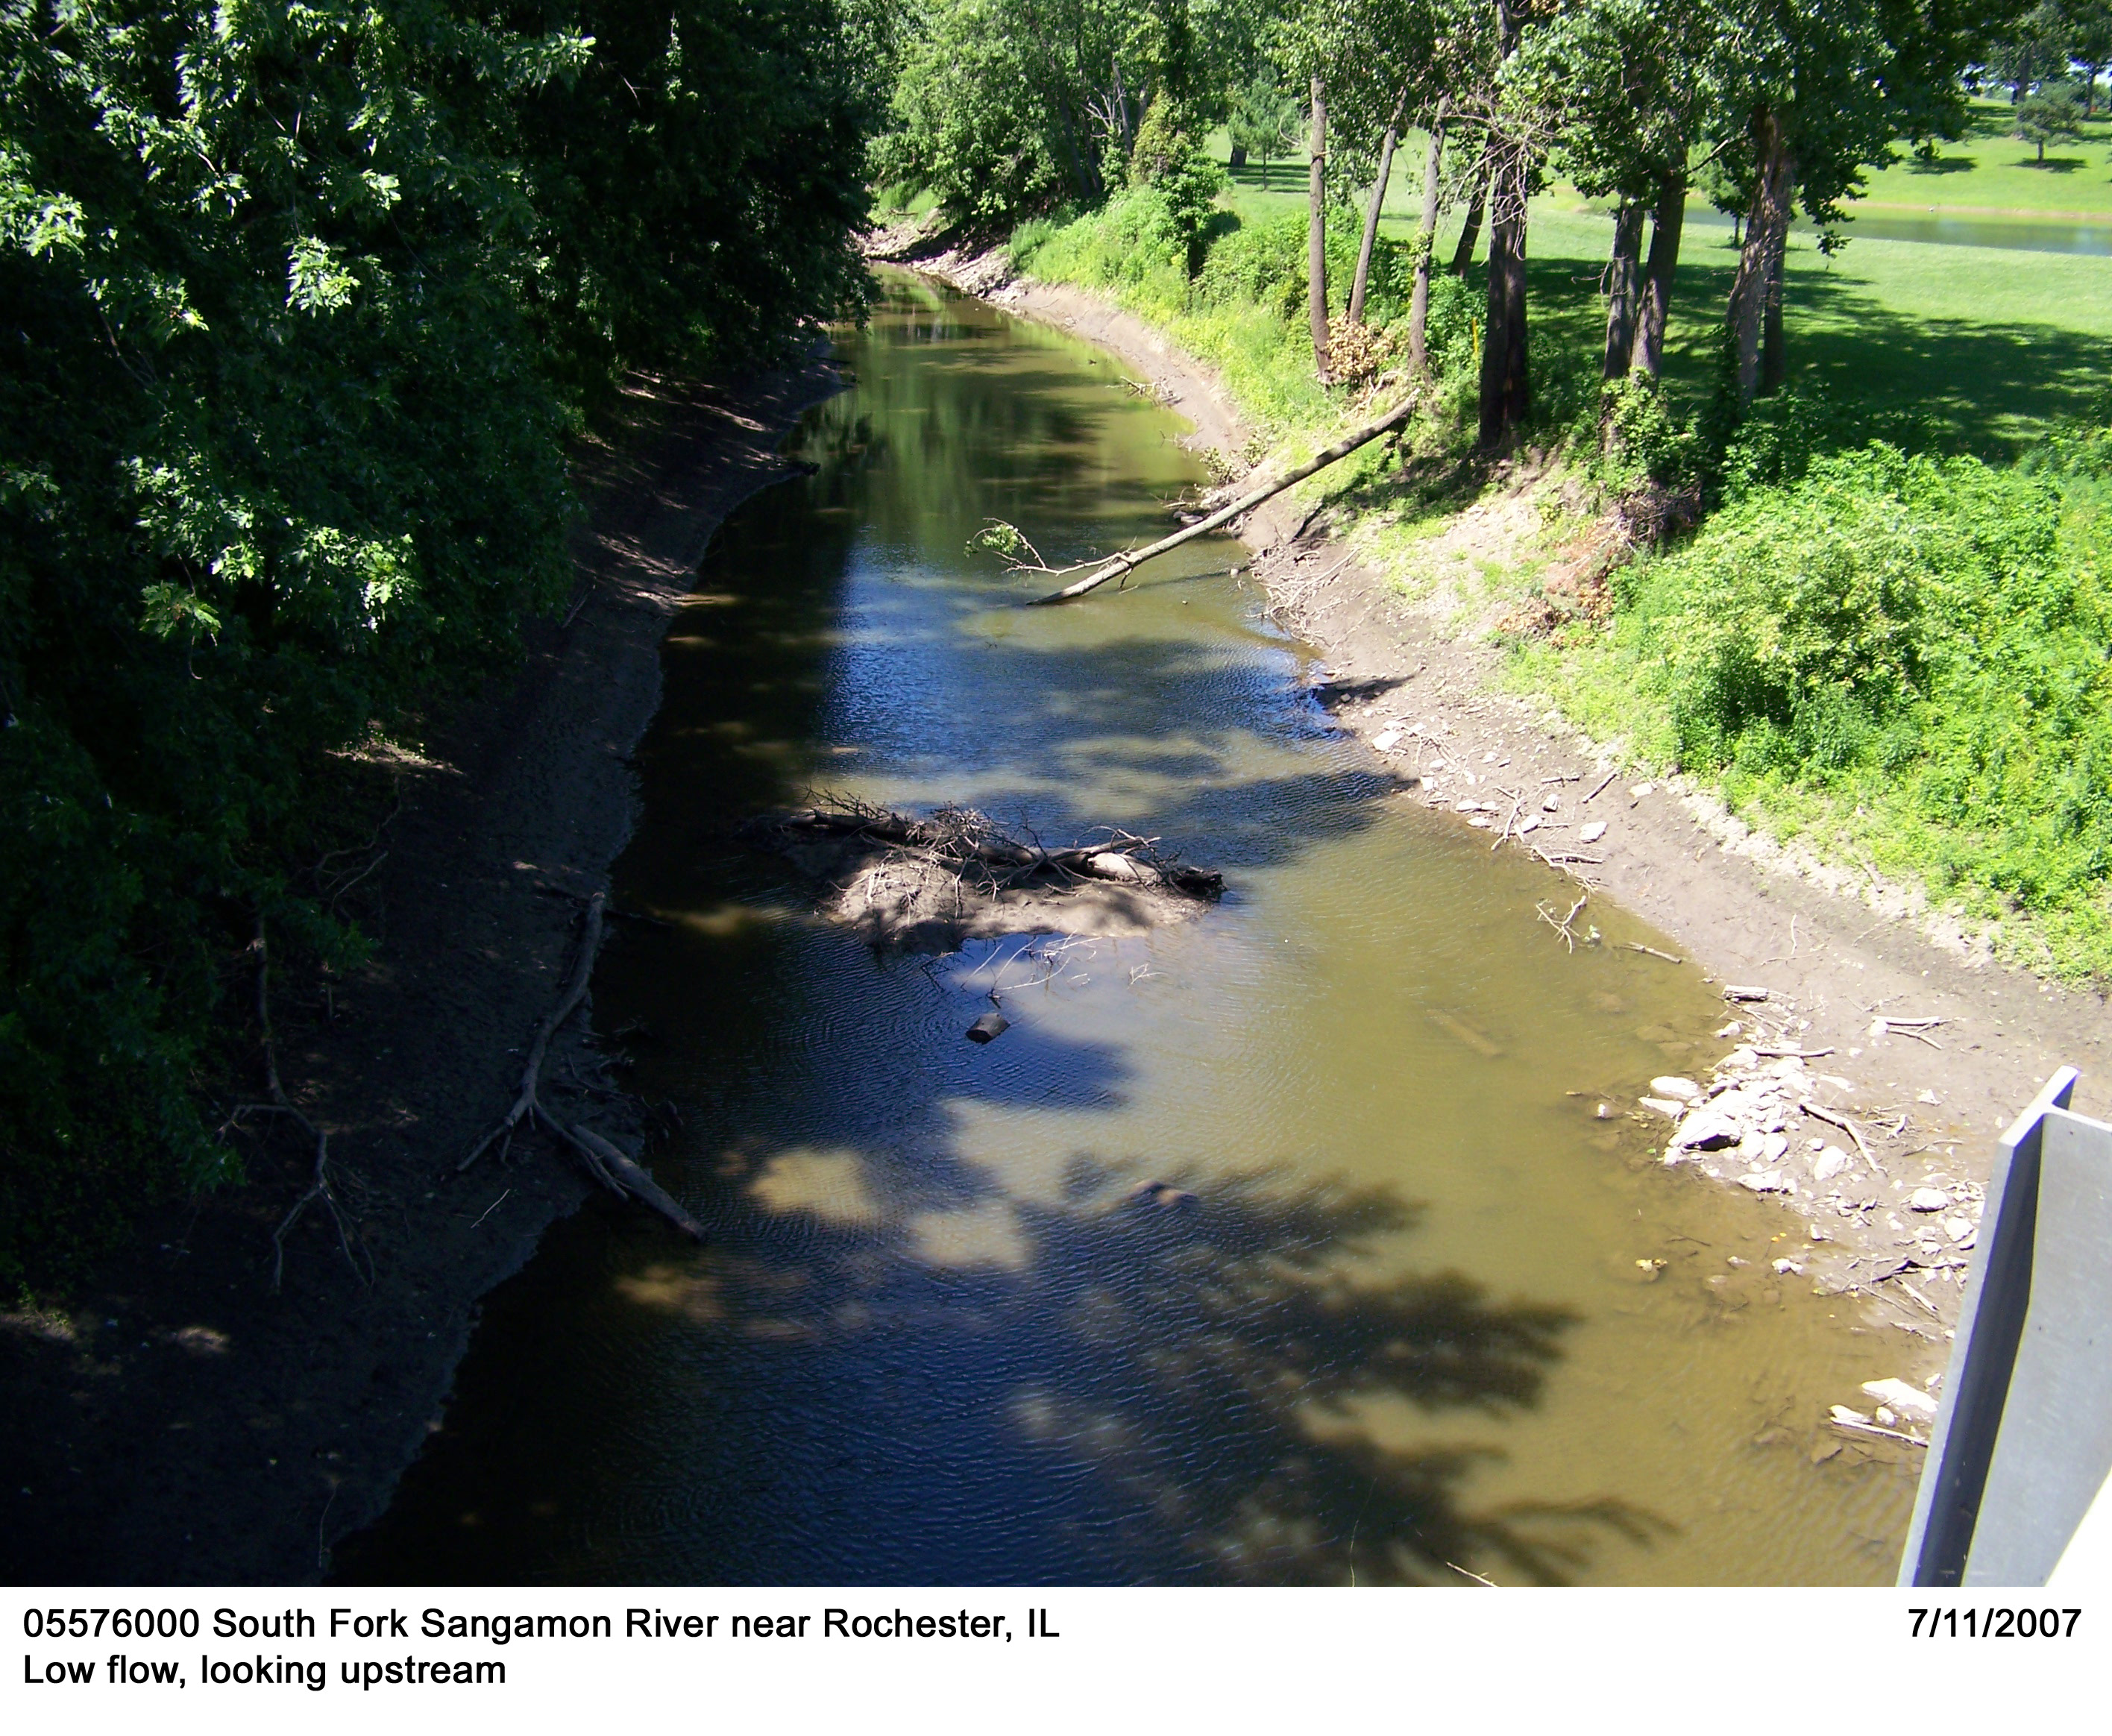
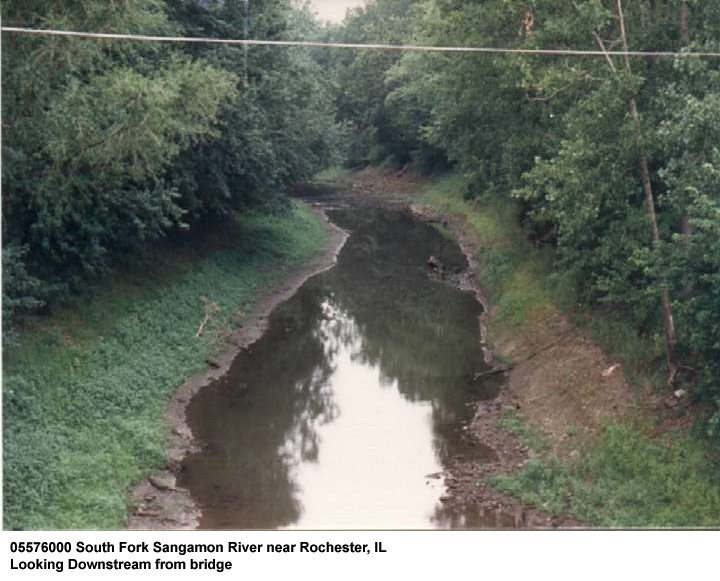
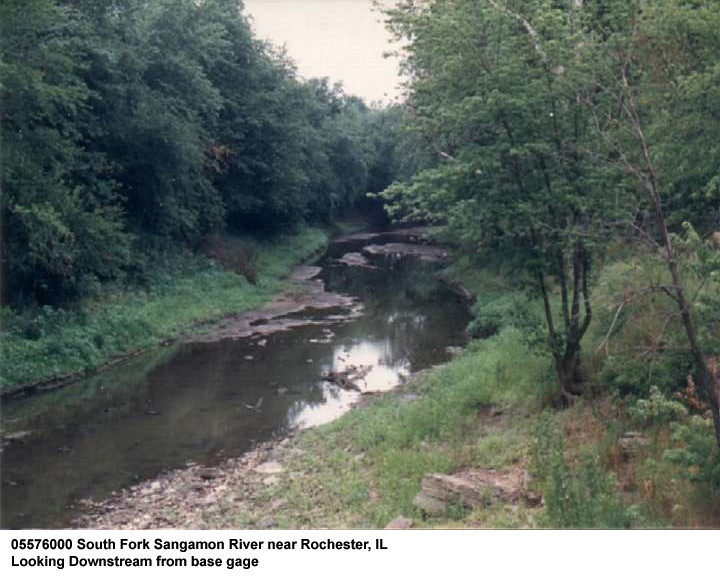
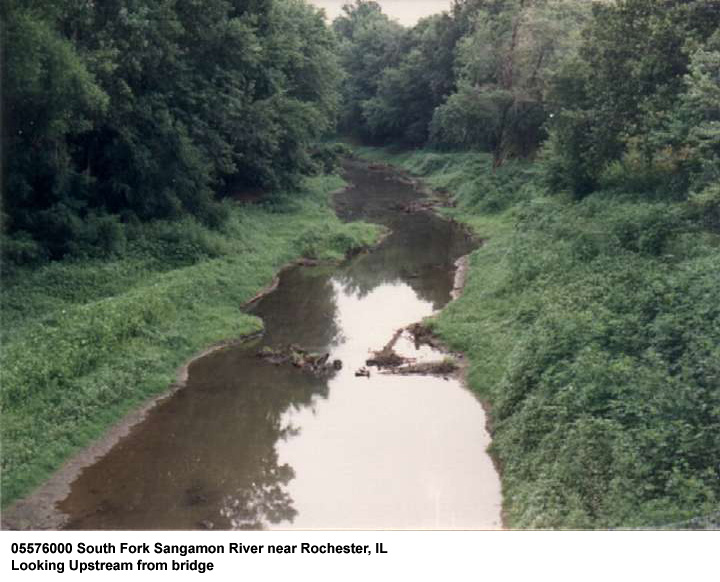
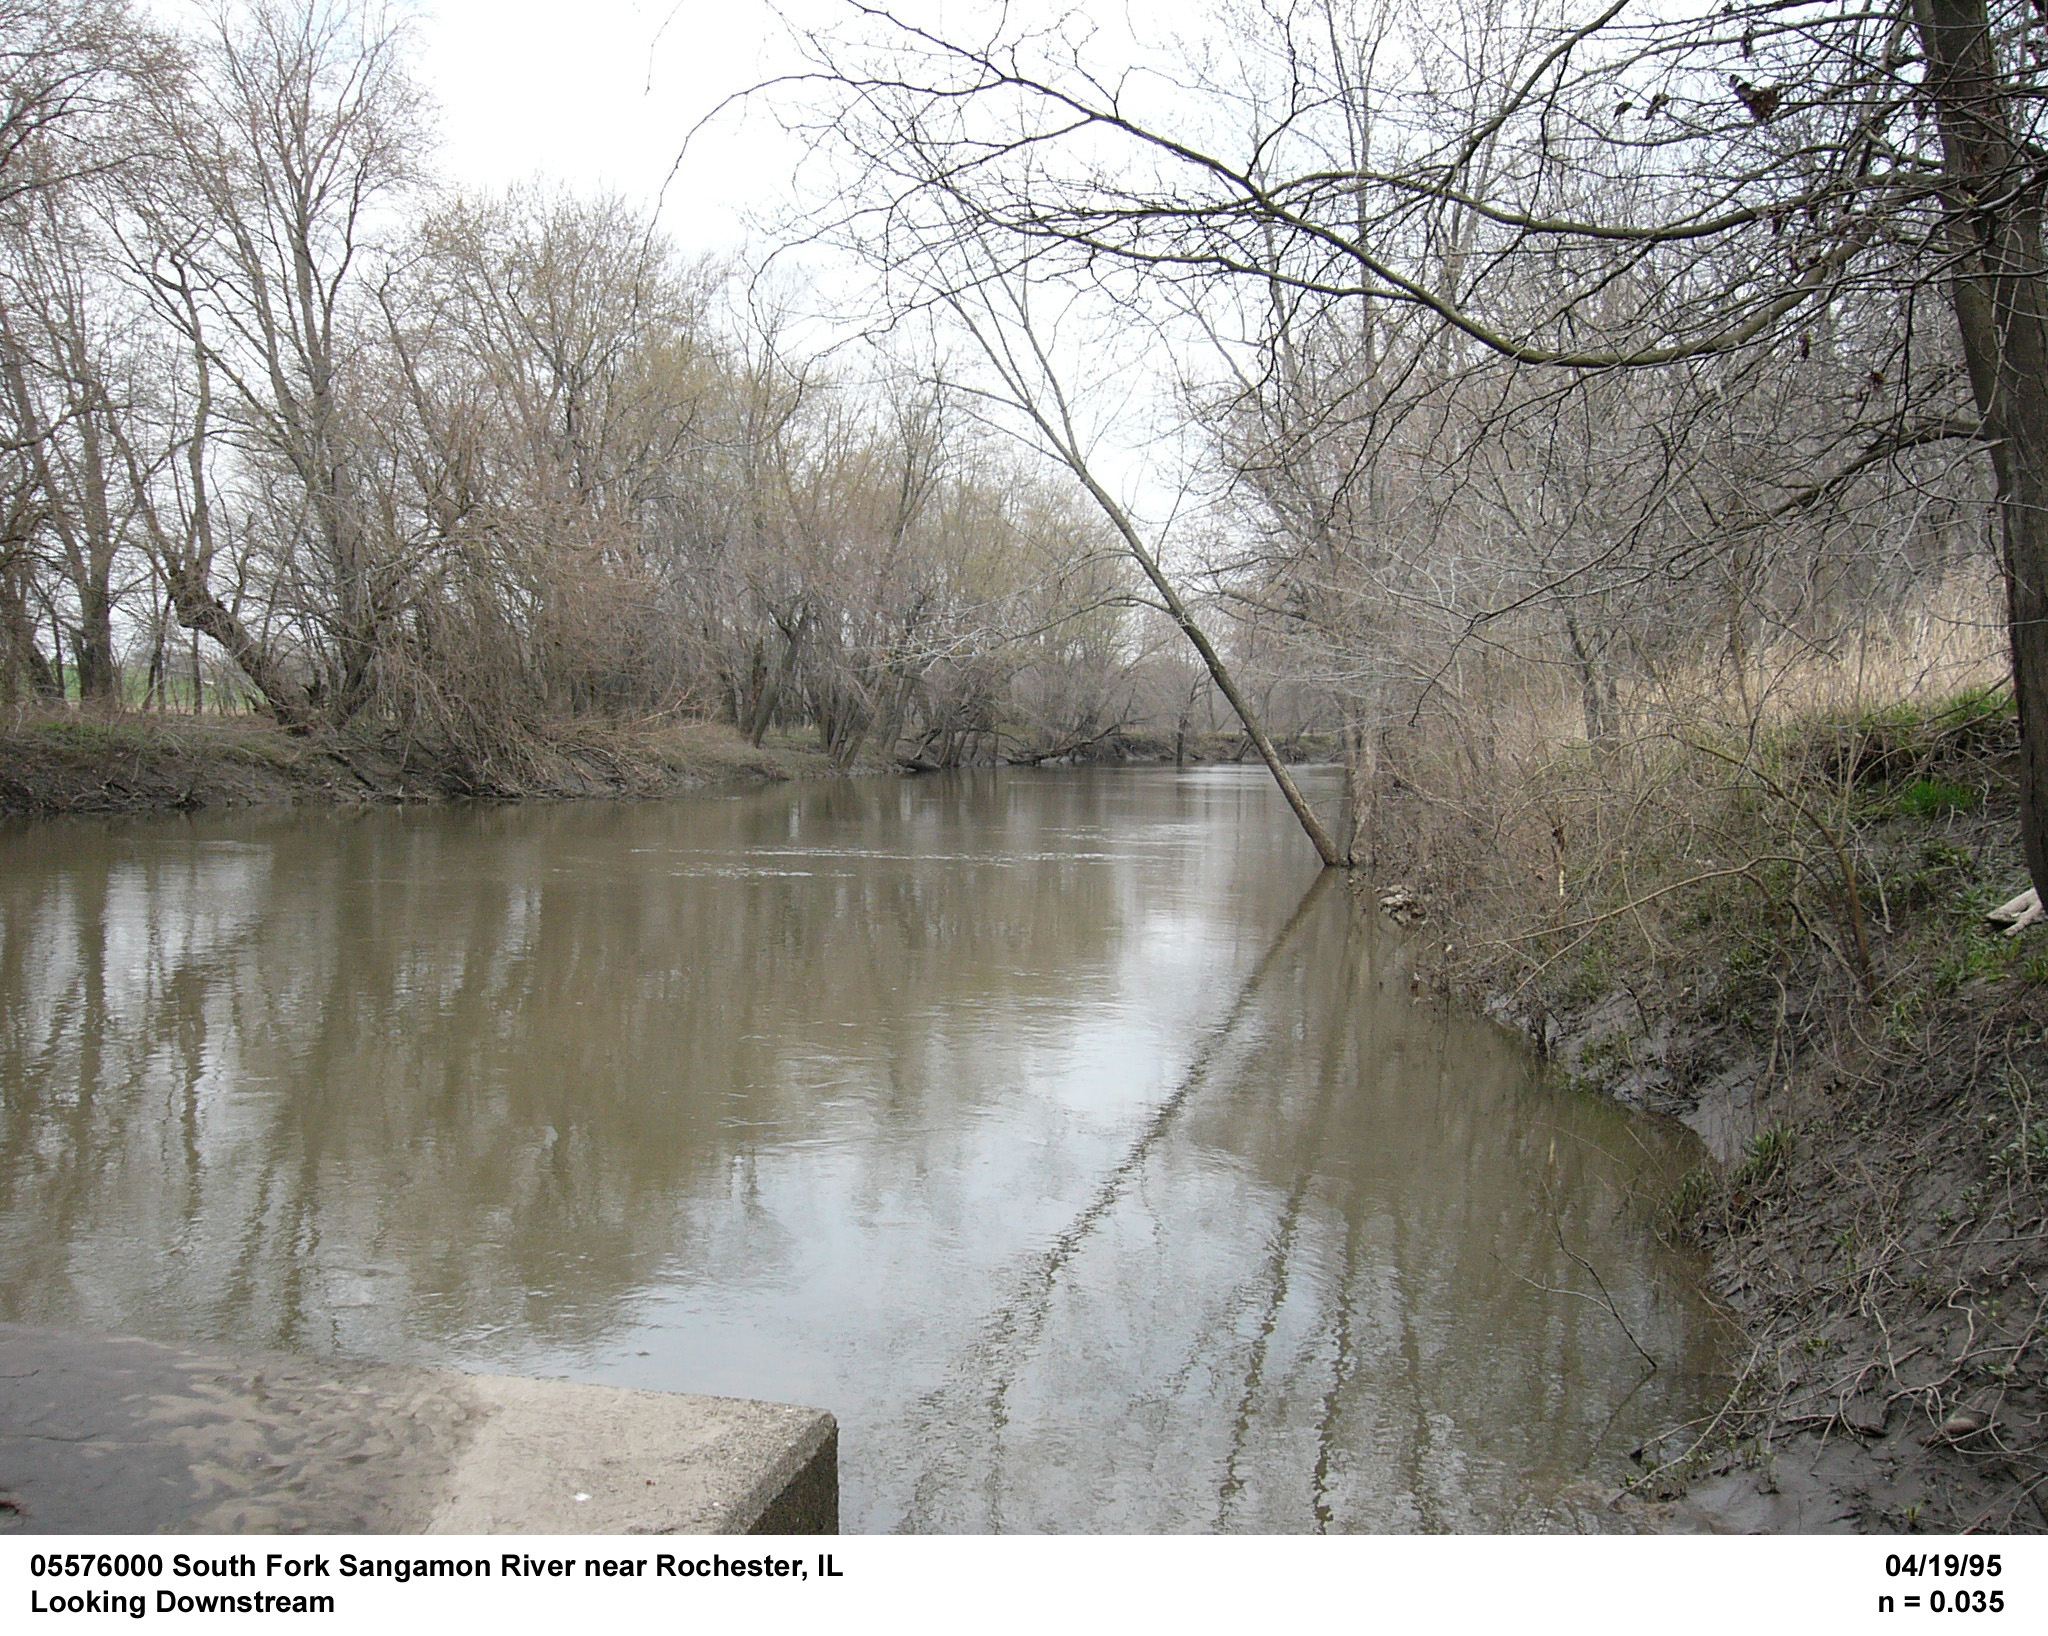
Description of Channel.--This channel is natural and is affected by urban areas. The streambed consists of rock, concrete rubble, and mixtures of sand and silt/clay. Tall vegetation grows on top of the banks and on the flood plains on both sides of the channel. From upstream (base gage) to downstream, cross sections are generally trapezoidal in shape but become narrower and deeper in the downstream direction. The bottom width varies from approximately 60 ft at the upstream end to 40 ft at the downstream end; top width varies from approximately 100 ft upstream to 120 ft downstream. Bank height varies from 15 ft upstream to 20 ft downstream. The study reach is subject to the accumulation of debris. The study reach can be described as a meandering reach containing a nearly 90-degree bend.
Floods.--Maximum discharge, 20,300 ft3/s, Apr. 14, 1994, gage height, 32.40 ft; maximum gage height, 33.65 ft, May 13, 2002, discharge 14,100 ft3/s.

![]() U.S. Department of the Interior |
U.S. Geological Survey
U.S. Department of the Interior |
U.S. Geological Survey
URL: http://il.water.usgs.gov/proj/nvalues/db/sites/05576000.shtml[an error occurred while processing this directive]?
Page Contact Information: David Soong
Page Last Modified: February 4, 2013
