

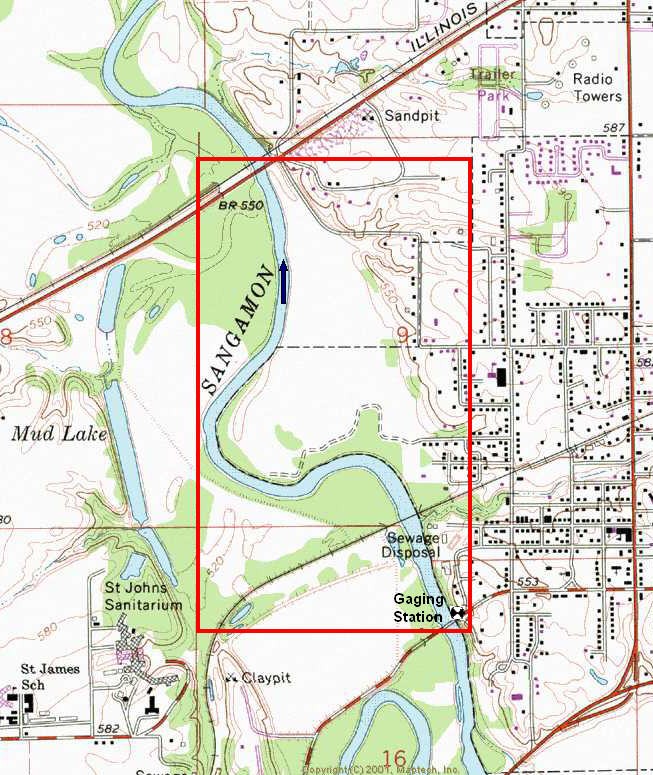
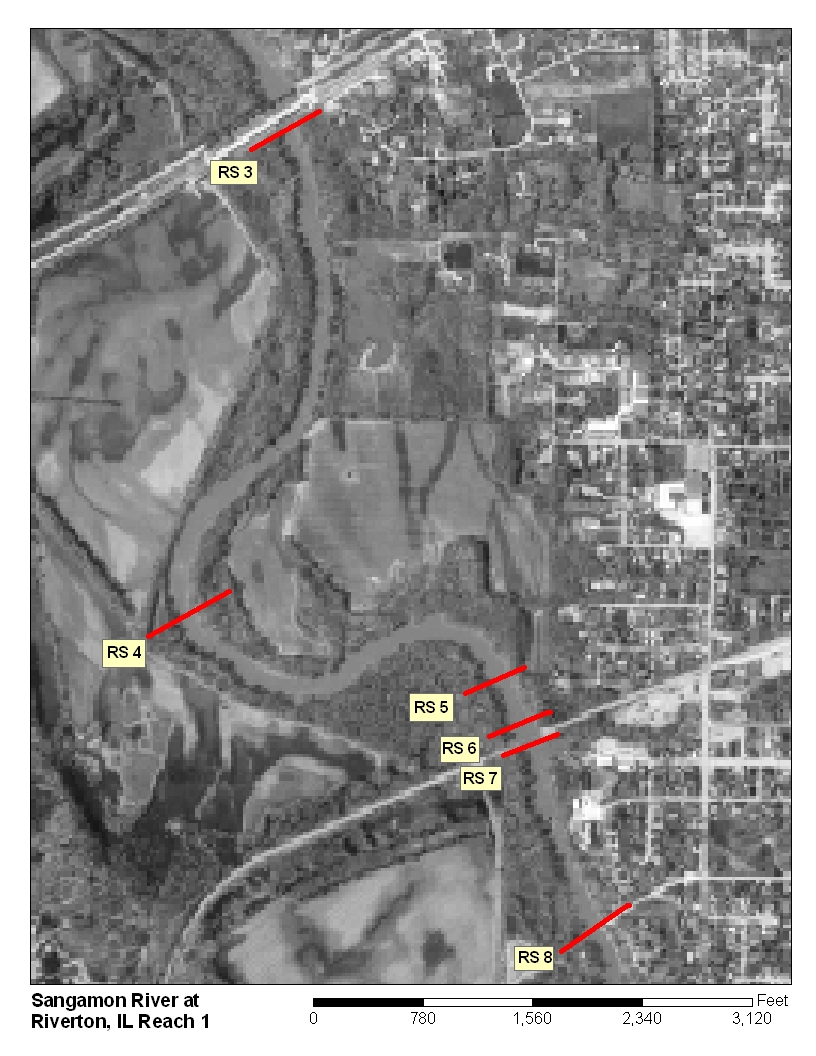
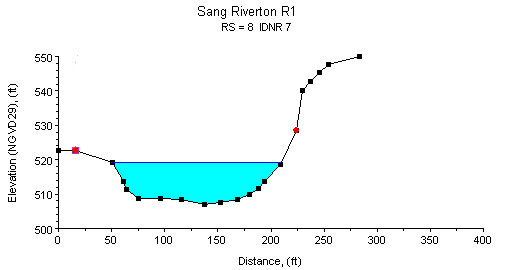
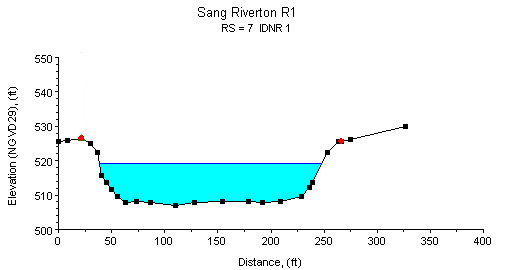
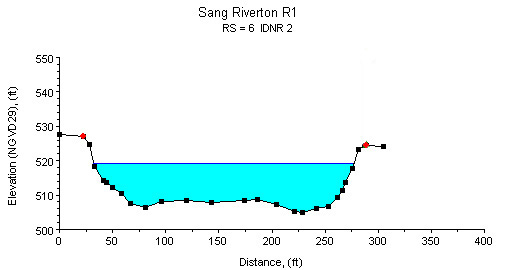

Study Reach.--The channel reach is a meandering, natural river. The study reach is approximately 8,600 ft long and extends from the abandoned Old River Road bridge to the upstream side of the State Highway 54 bridge, as shown in the quadrangle map on the top left. Six surveyed cross sections (surveyed by the Illinois Department of Natural Resources, in December 2003) are available for evaluating the channel geometries in the study reach. The channel alignment, approximate variations in channel width and bank conditions, and locations of surveyed cross sections are shown in the aerial photograph on the top right. Cross-sectional geometries vary gradually from upstream to downstream (see plots above). The alignment of the study reach, approximate variations in channel width and bank conditions, and locations of the surveyed cross sections are shown in the aerial photograph on the top right.
Gage Location.--Lat 39°50'35", long 89°32'50"(revised WY2000), NW1/4 NE1/4 sec.16, T.16N., R.4W., Sangamon County, Hydrologic Unit 07130008, at the right abutment on former U.S. Highway 36 bridge in Riverton, 2.2 mi downstream from Sugar Creek, 5.6 mi upstream from Fancy Creek, and at river mi 83.1. The USGS streamgage station number is 05576500.
Drainage Area.--2,618 sq mi.
Gage Datum and Elevations of Reference Points.--Datum of the gage is 508.38 ft. A wire-weight gage (WWG) is attached to the downstream, streamward side of the bridge abutment of the Old River Road abandoned bridge. A reference point for n-value study (RP-N1) is established as the top of the nut on the concrete anchor on the upstream side of Highway 54 bridge, elevation=551.769 ft. All elevations are referenced to NGVD29.
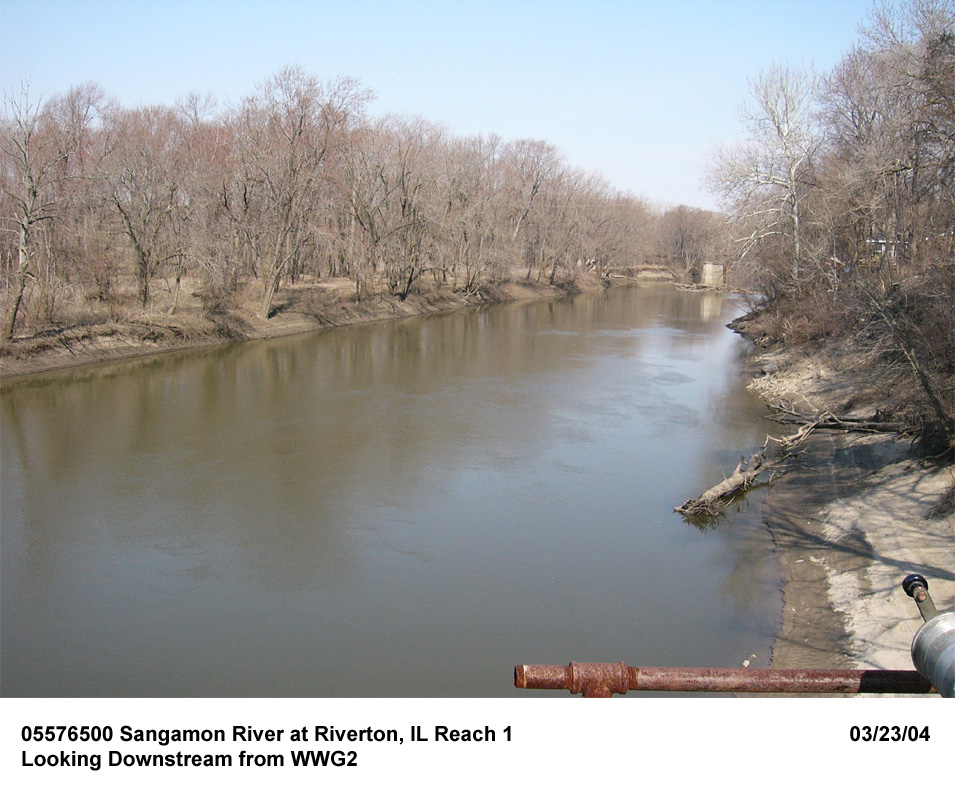
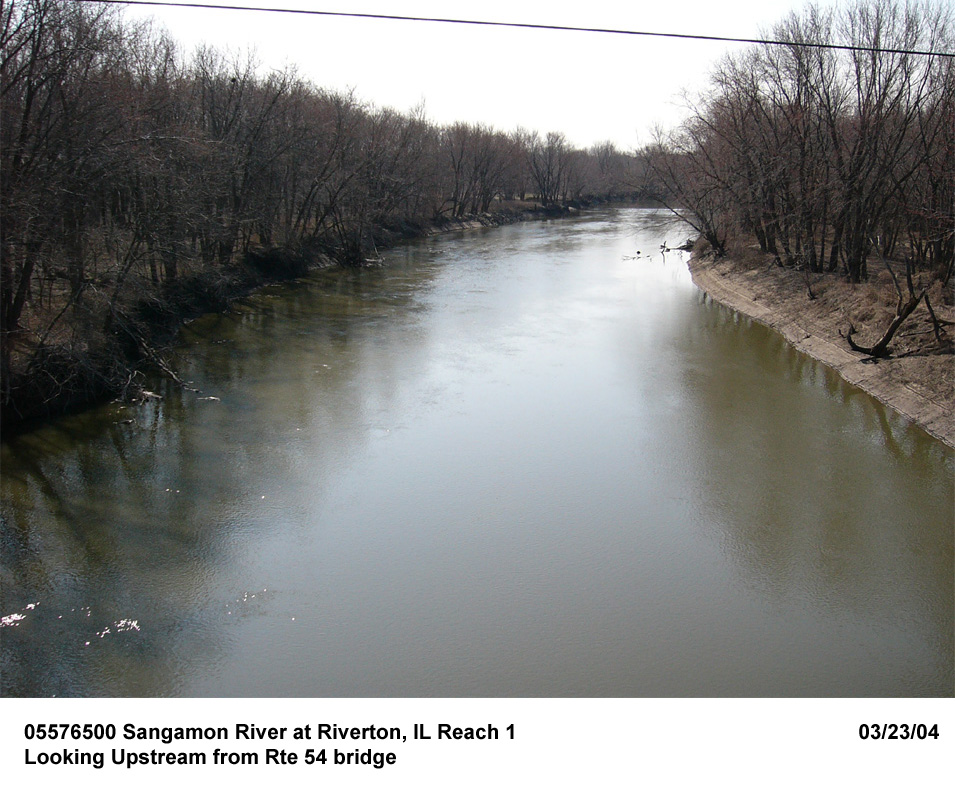
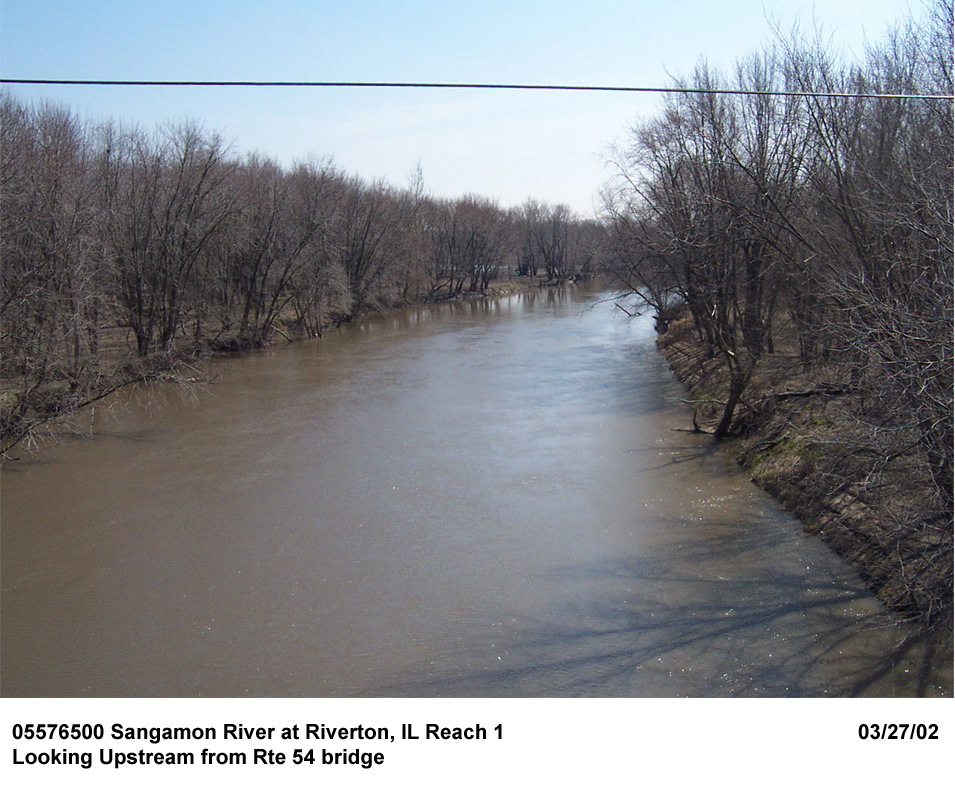
Stage, Discharge Measurements and Computed n-Values.--Water-surface elevations are measured from the WWG and from RP-N1 before, during, and after a discharge measurement. Discharge measurements are made using the conventional current-meter method. The computed n-values are listed in the following table. Whenever possible, the computed n-values are associated with a photograph taken at the time of the measurement. The photographs are arranged from low to high discharge in order to illustrate the contributing factors of n-values at a particular discharge.
| Date of Observation | Discharge (ft3/s) | Average Cross Section Area (ft2) | Hydraulic Radius (ft) | Mean Velocity (ft/s) | Slope (ft/ft) | Coefficient of Roughness n |
|---|---|---|---|---|---|---|
| 7/20/2004 | 676.0 | 688.5 | 4.43 | 1.13 | 0.000132 | 0.034 |
| 3/23/2004 | 1100.0 | 897.2 | 5.43 | 1.40 | 0.000137 | 0.031 |
| 9/1/2004 | 1680.0 | 1080.4 | 6.01 | 1.75 | 0.000135 | 0.025 |
| 10/19/2004 | 2580.0 | 1427.5 | 7.41 | 1.98 | 0.000149 | 0.027 |
| 3/27/2002 | 3590.0 | 1738.6 | 8.55 | 2.22 | 0.000149 | 0.027 |
| 5/28/2004 | 5060.0 | 2334.4 | 10.18 | 2.29 | 0.000149 | 0.030 |
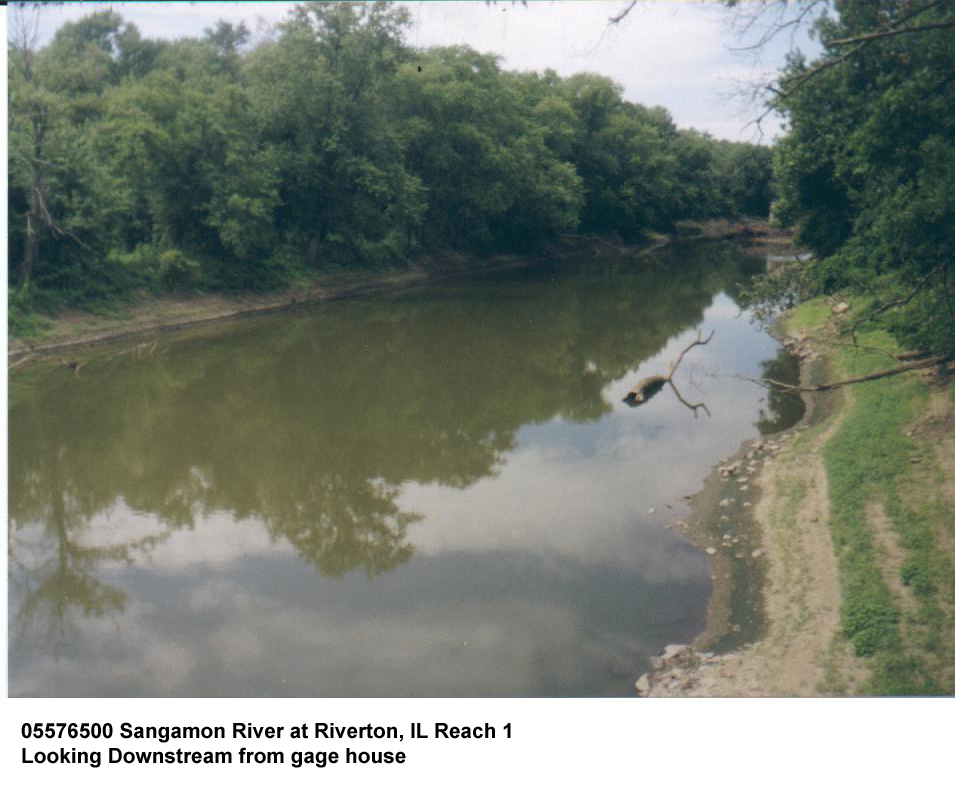
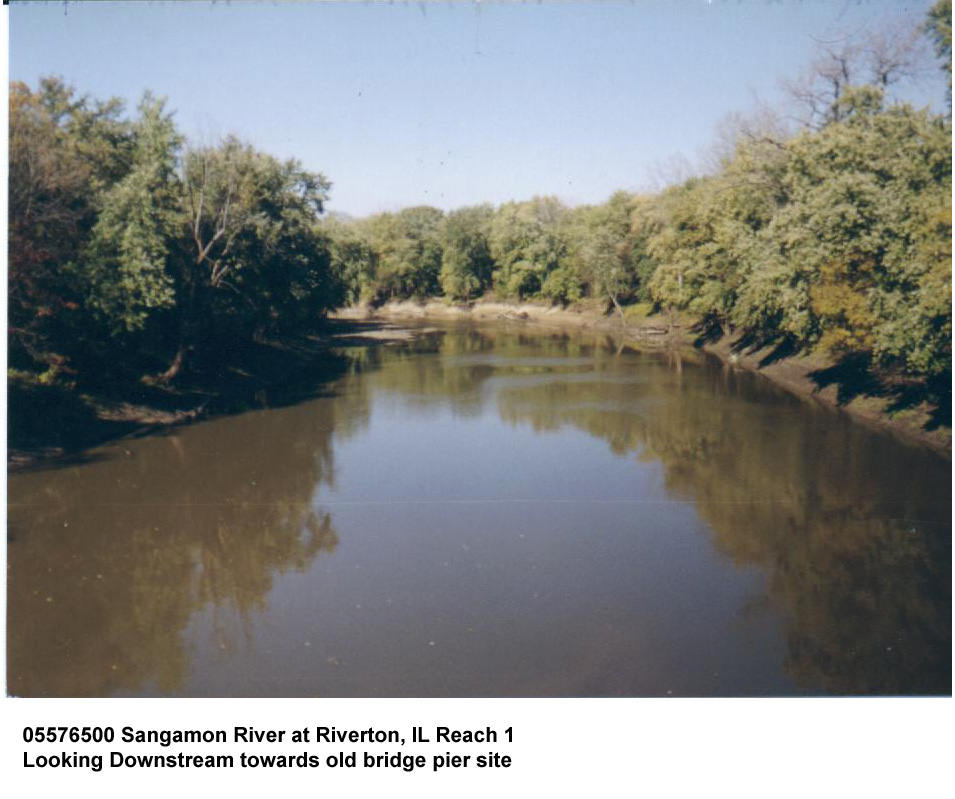
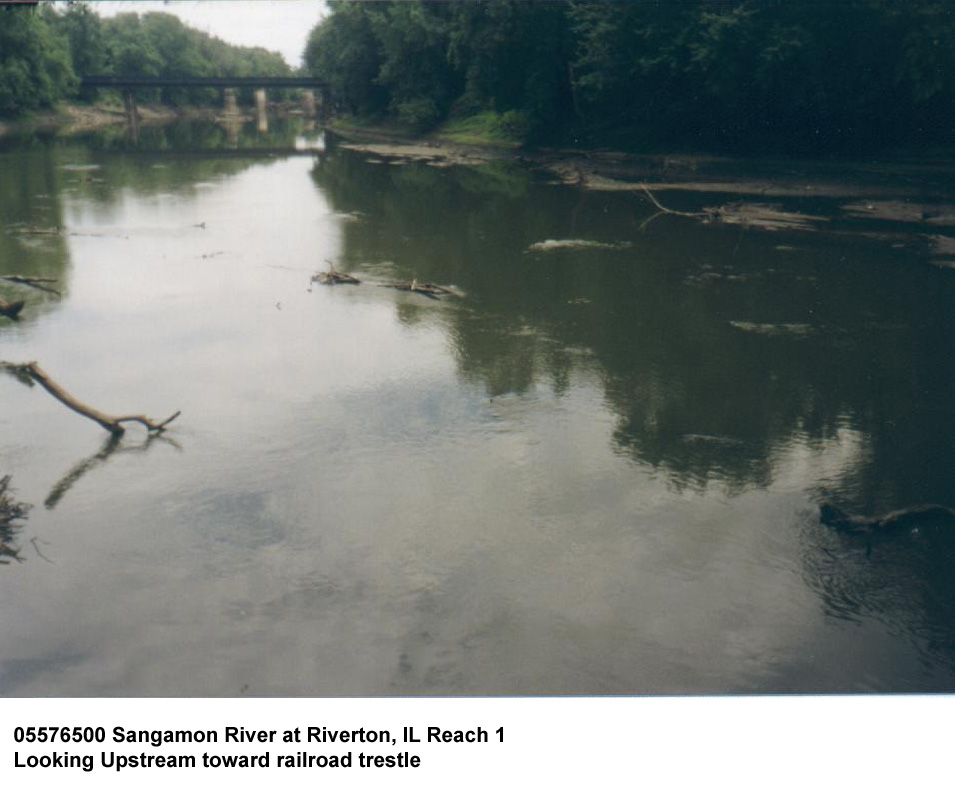
Description of Channel.--This channel is natural and meandering. Bed material consists of sand and gravel. The banks are bare earth, shales, clay and sand. The cross sectional shape is generally trapezoidal except for the upstream meandering reach. The channel widens in the downstream direction. In the downstream straight reach, bottom width is about 150 ft and top width is about 200 ft, with a bank height around 15 ft. Sandbars were observed on the relatively flat streambed.
Floods.--Maximum discharge, 68,700 ft3/s, May 19, 1943, gage height, 31.52 ft, from graph based on gage readings.

![]() U.S. Department of the Interior |
U.S. Geological Survey
U.S. Department of the Interior |
U.S. Geological Survey
URL: http://il.water.usgs.gov/proj/nvalues/db/sites/05576501.shtml[an error occurred while processing this directive]?
Page Contact Information: David Soong
Page Last Modified: February 4, 2013
