


Study Reach.--The channel reach is a straight, natural river as shown in the quadrangle map on the top left. The study reach is 2,210 ft long and is located between the downstream side of the Old Route 36 bridge (as upstream) and the upstream site of the abandoned Old River Road bridge (as downstream). Four surveyed cross sections (surveyed by the Illinois Department of Natural Resources, in December 2003) are available for evaluating the channel geometries in the study reach (see plots above). The alignment of the study reach, approximate variations in channel width and bank conditions, and locations of the surveyed cross sections are shown in the aerial photograph on the top right.
Gage Location.--Lat 39°50'35", long 89°32'50"(revised WY2000), NW1/4 NE1/4 sec.16, T.16N., R.4W., Sangamon County, Hydrologic Unit 07130008, at the right abutment on the former U.S. Highway 36 bridge in Riverton, 2.2 mi downstream from Sugar Creek, 5.6 mi upstream from Fancy Creek, and at river mi 83.1. The USGS streamgage station number is 05576500.
Drainage Area.--2,618 sq mi.
Gage Datum and Elevations of Reference Points.--Datum of the gage is 508.38 ft. A reference point established for the n-values study, RP-N2, is the top of the nut on the bolt in the 30th I-beam from the left end of the bridge on the downstream side of the Old Route 36 bridge, elevation=550.028 ft. A wire-weight-gage (WWG) is attached to the downstream, streamward side of the bridge abutment of the Old River Road abandoned bridge. All elevations are referenced to NGVD29.
Stage, Discharge Measurements, and Computed n-Values.--Water-surface elevations were measured from RP-N2 and the WWG before and after each discharge measurement. Water-surface slope was derived by dividing the difference in water-surface elevations by the distance between them. Discharge measurements were made using the conventional current-meter method. The computed n-values are listed in the following table. Whenever possible, the computed n-values are associated with a photograph taken at the time of the measurement. The photographs are arranged from low to high discharge in order to illustrate the contributing factors of n-values at a particular discharge.
| Date of Observation | Discharge (ft3/s) | Average Cross Section Area (ft2) | Hydraulic Radius (ft) | Mean Velocity (ft/s) | Slope (ft/ft) | Coefficient of Roughness n |
|---|---|---|---|---|---|---|
| 7/20/2004 | 676.0 | 540.2 | 3.72 | 1.28 | 0.000199 | 0.040 |
| 3/23/2004 | 1100.0 | 741.7 | 4.85 | 1.50 | 0.000181 | 0.039 |
| 9/1/2004 | 1680.0 | 911.7 | 5.75 | 1.85 | 0.000199 | 0.037 |
| 10/19/2004 | 2580.0 | 1229.6 | 7.35 | 2.11 | 0.000195 | 0.037 |
| 5/28/2004 | 5060.0 | 2018.9 | 10.27 | 2.51 | 0.000195 | 0.038 |
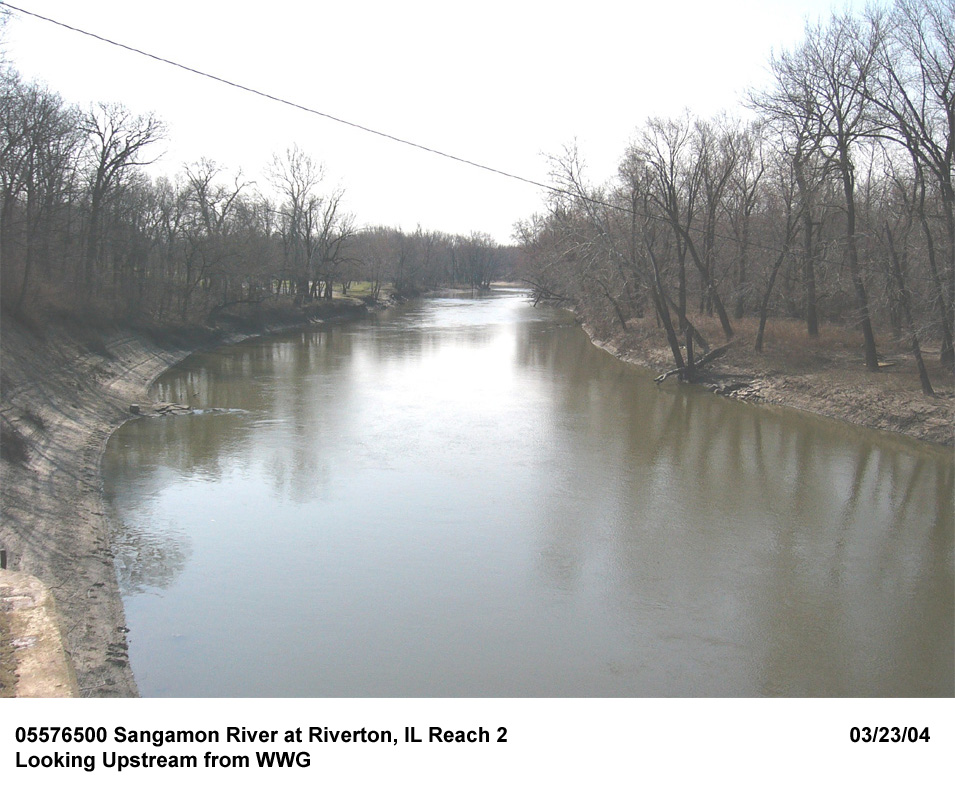
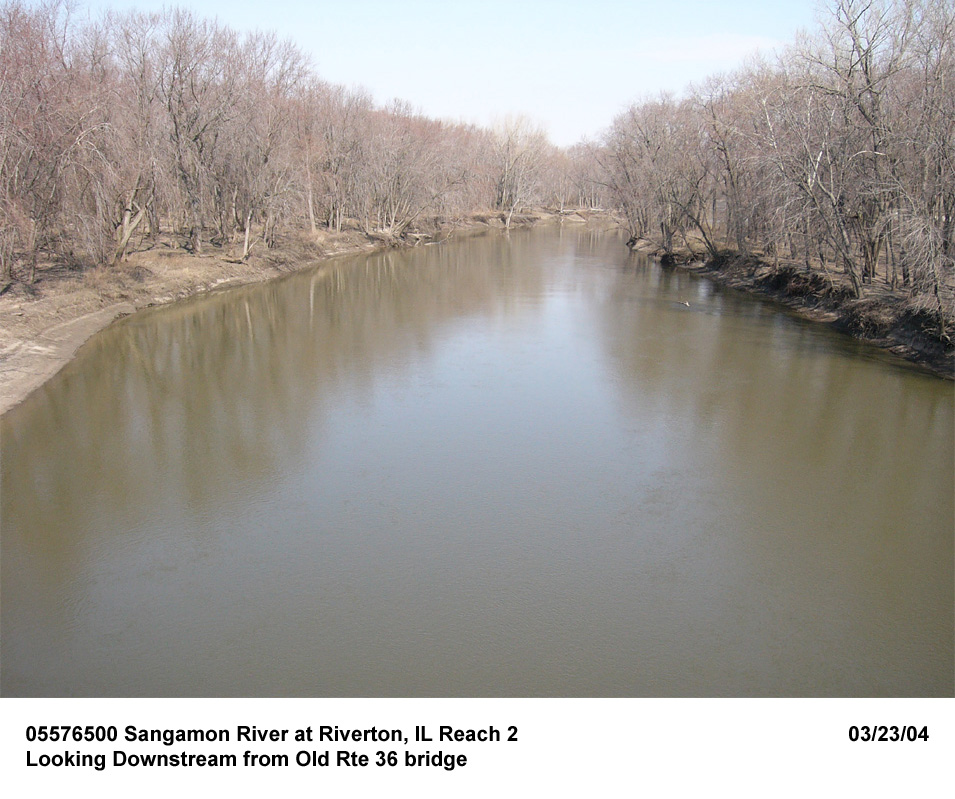
Description of Channel.--This is a natural channel in a straight reach. Bed materials consist of sand and gravel. The banks are bare earth, shales, clay and sand. Cross-sectional geometry is of trapezoidal shape and longitudinal variations are from deeper and wider upstream to shallower and narrower downstream. The bottom width ranges from approximately 100 to 150 ft. Bank height varies from 12 to 16 ft and top width of the channel varies approximately from 200 to 250 ft. Sandbars were observed on the relatively flat streambed. The channel has wide flood plains but only in-channel events were used in the study.
Floods.--Maximum discharge, 68,700 ft3/s, May 19, 1943, gage height, 31.52 ft, from graph based on gage readings.

![]() U.S. Department of the Interior |
U.S. Geological Survey
U.S. Department of the Interior |
U.S. Geological Survey
URL: http://il.water.usgs.gov/proj/nvalues/db/sites/05576502.shtml[an error occurred while processing this directive]?
Page Contact Information: David Soong
Page Last Modified: February 4, 2013
