

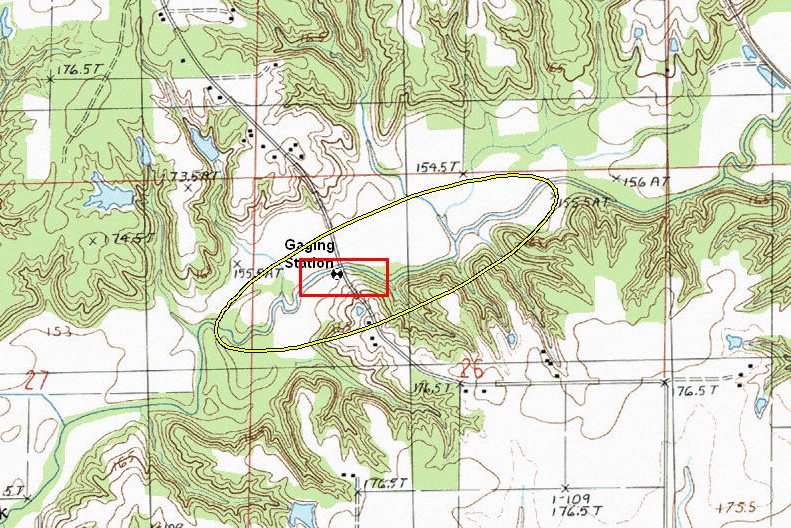
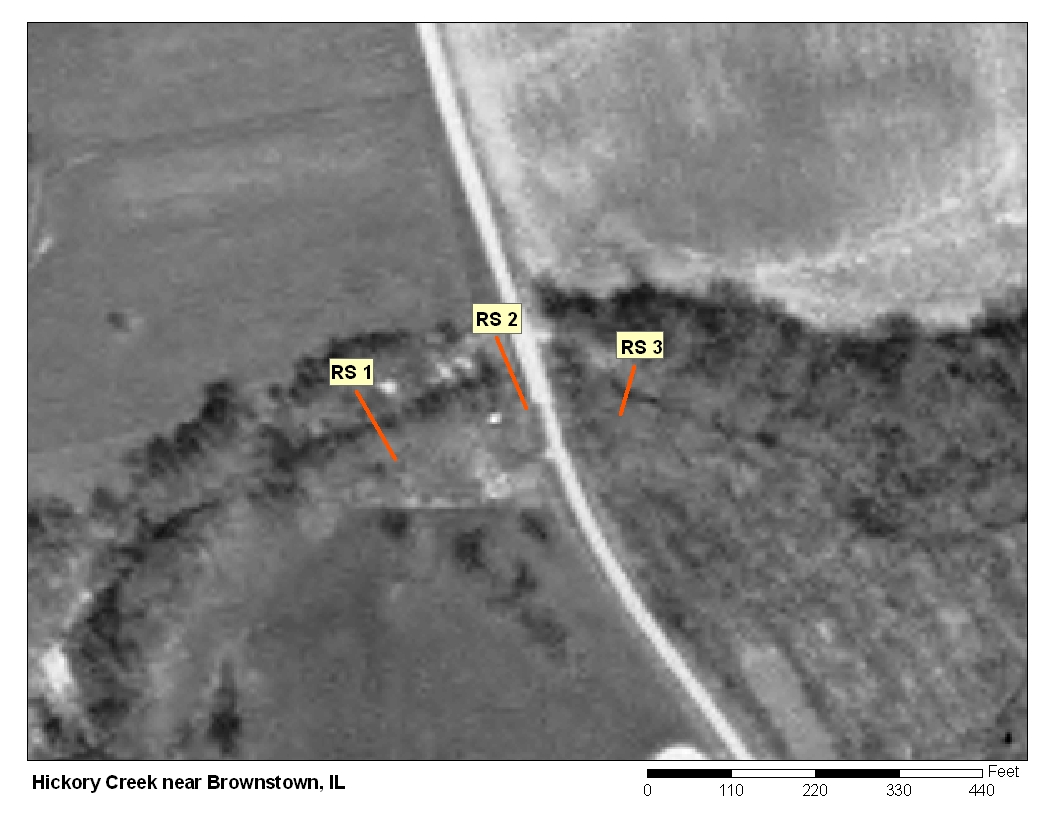
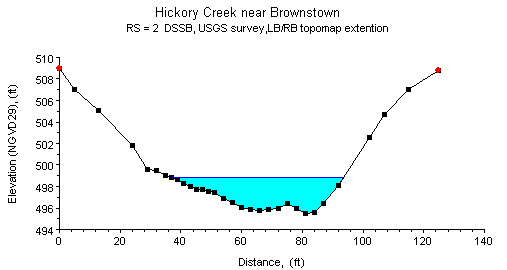
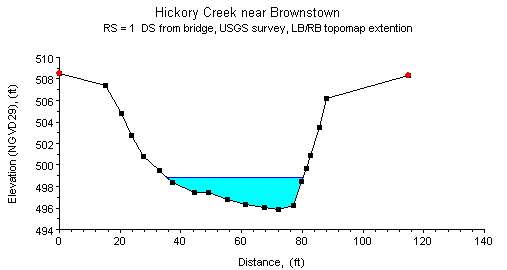
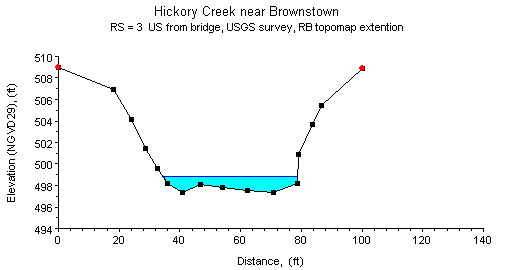
Study Reach.--The channel reach is natural and meandering in a rural area. The study reach, 300 ft long, is slightly off center of the county bridge, as shown in the quadrangle map on the top left. There are three cross sections (surveyed by the U.S. Geological Survey in March 2000) available for describing geometric characteristics in the study reach (see plots above). The channel alignment, approximate channel width and bank conditions, and locations of channel cross sections are presented in the aerial photograph on the top right.
Gage Location.--Lat 38°56'12", long 88°57'10", in NW1/4 NW1/4 sec.26, T.5N.,R.2E., Fayette County, Hydrologic Unit 07140202, on the left bank at the downstream side of the county bridge, about 4 mi south of Brownstown, 4.3 mi above Little Hickory Creek, and at river mi 12.0. The USGS streamgage station number is 05592575.
Drainage Area.--44.2 sq mi.
Gage Datum and Elevations of Reference Points.--Datum of the gage is 493.37 ft. A wire-weight gage (WWG) is attached to the downstream handrail of the bridge on County Road 1575. A reference point for the n-value study, RP-N5, is a nail in an overhanging tree about 150 ft upstream from the bridge on the left bank; elevation = 502.95 ft. All elevations are referenced to NGVD29.
Stage, Discharge Measurements, and Computed n-Values.--Water-surface elevations were measured by tape down at RP-N5 and by reading the WWG at the county bridge before and after the discharge measurements. In addition, a series of high water marks were obtained along the study reach. Corresponding water-surface slope was determined by dividing the water-surface elevations by the distances between pairs of high water marks and/or the reference point. Discharge measurements were made with the conventional current-meter method. The computed n-values are listed in the following table. Whenever possible, the computed n-values are associated with a photograph taken at the time of the measurement. The photographs are arranged from low to high discharge in order to illustrate the contributing factors of n-values at a particular discharge.
| Date of Observation | Discharge (ft3/s) | Average Cross Section Area (ft2) | Hydraulic Radius (ft) | Mean Velocity (ft/s) | Slope (ft/ft) | Coefficient of Roughness n |
|---|---|---|---|---|---|---|
| 1/25/1999 | 77.6 | 84.4 | 1.67 | 1.05 | 0.000022 | 0.028 |
| 1/22/1999 | 2980.0 | 764.1 | 6.74 | 4.03 | 0.002254 | 0.061 |
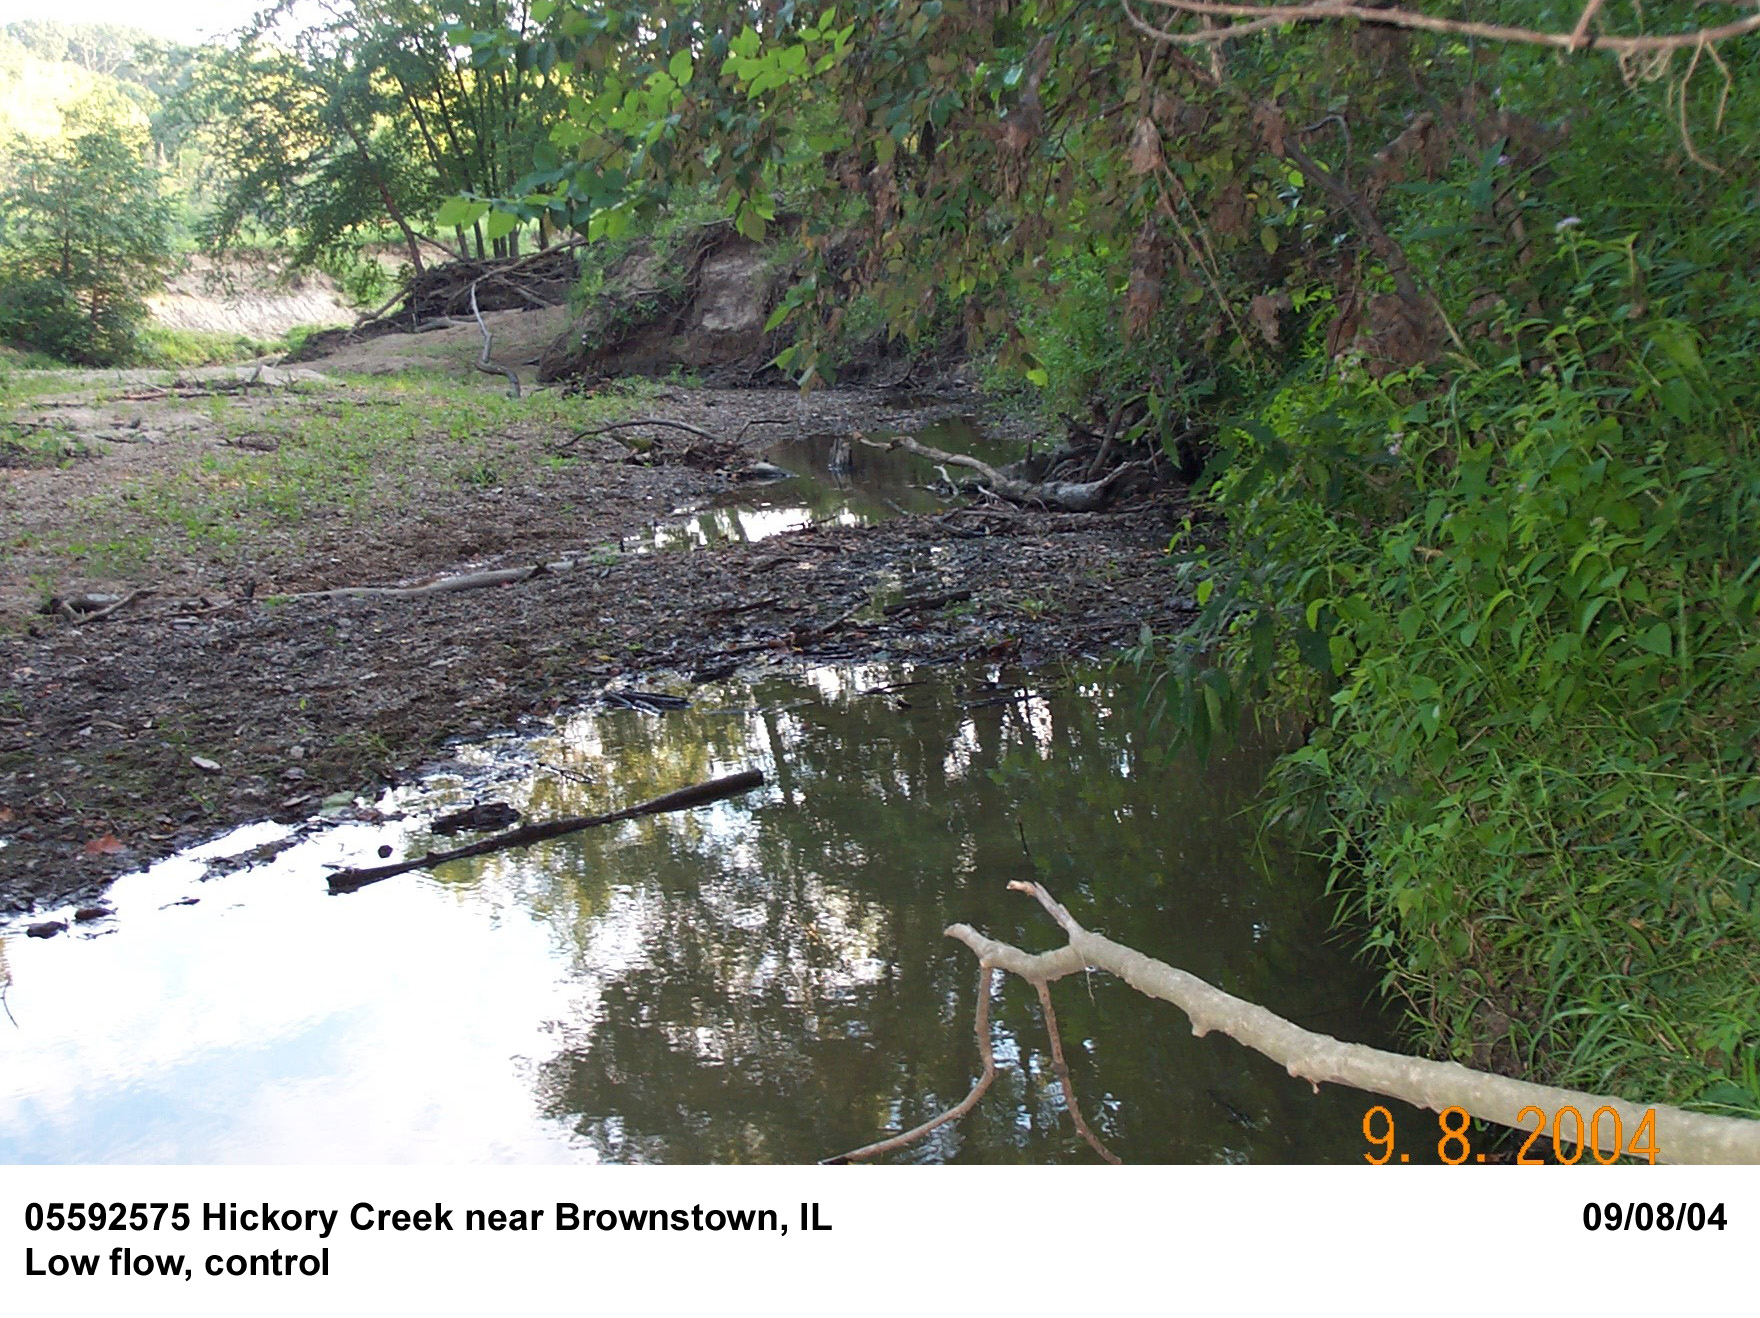
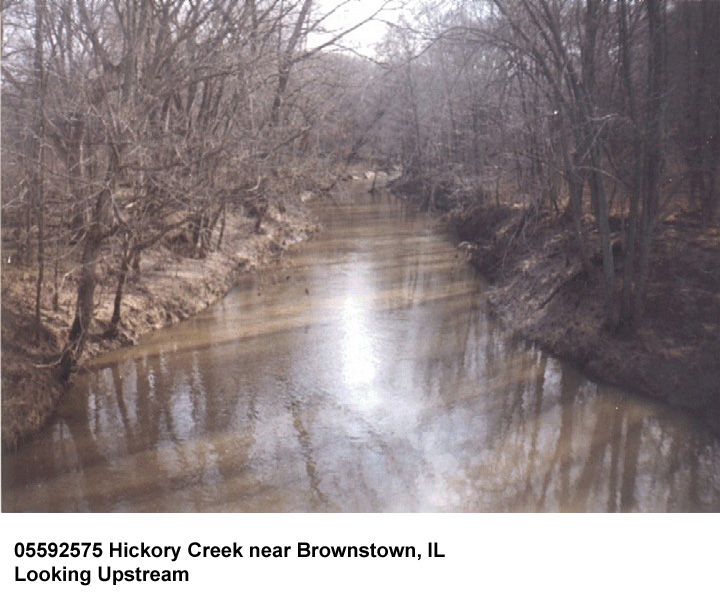
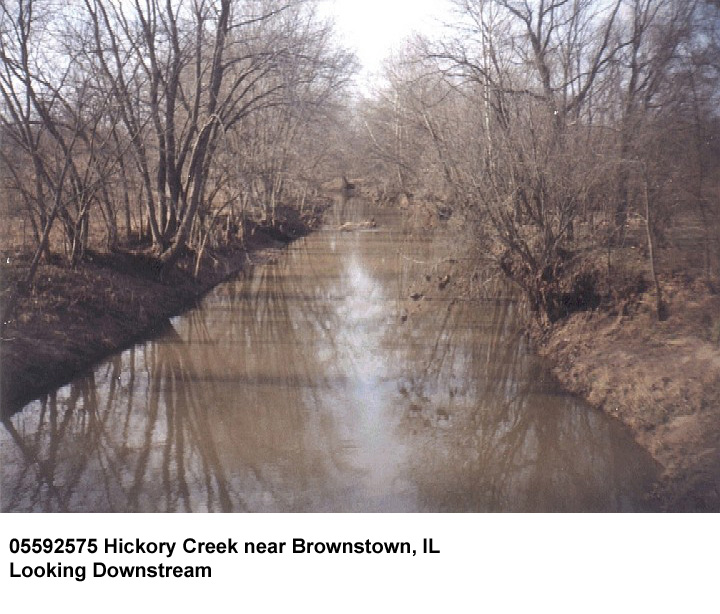
Description of Channel.--This channel is a natural channel. The study reach is located in a meandering section. The bed material consists of medium sized gravels. The channel cross section can be described as trapezoidal. The width of the channel bottom is approximately 40 ft and approximately 80 ft at the top of the bank. Bank height is approximately 10 ft. Both bank faces are lined with grass and trees grow on top of the banks. Beyond the initial line of trees, the vegetation becomes less dense on the floodplain.
Floods.--Flood of May 8, 2003, gage height, 16.48 ft, Discharge, 6,100 ft3/s; Flood of Nov. 14, 1993; reached a stage of 16.43 ft; discharge of 6,250 ft3/s.

![]() U.S. Department of the Interior |
U.S. Geological Survey
U.S. Department of the Interior |
U.S. Geological Survey
URL: http://il.water.usgs.gov/proj/nvalues/db/sites/05592575.shtml[an error occurred while processing this directive]?
Page Contact Information: David Soong
Page Last Modified: February 4, 2013
