

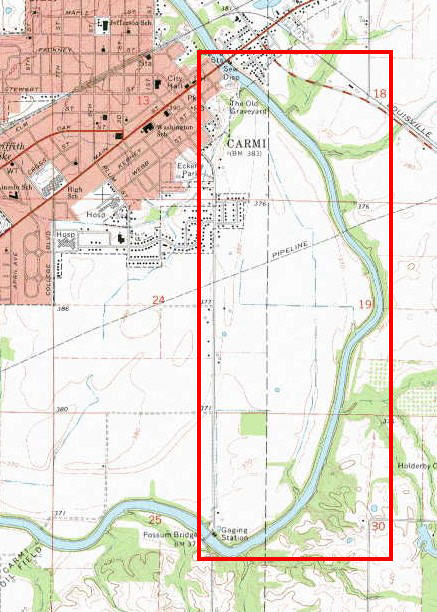
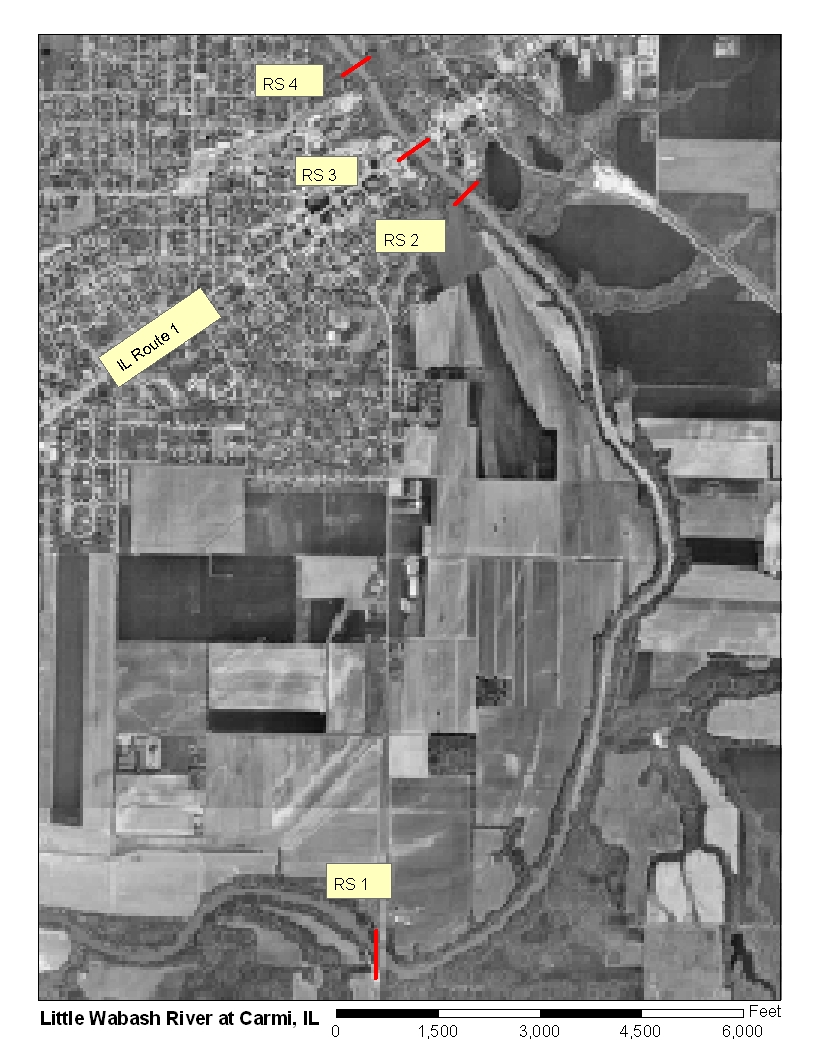
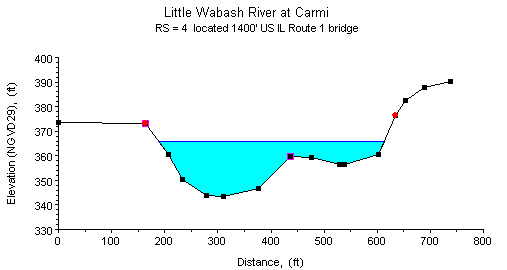
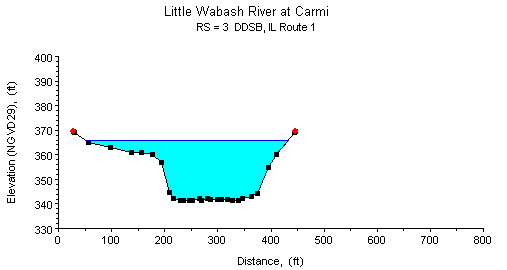
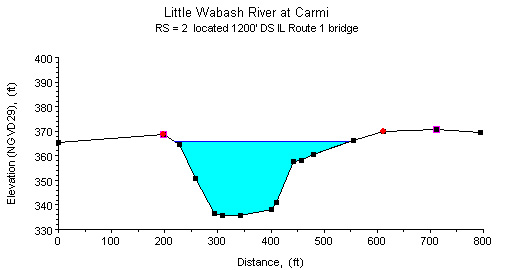
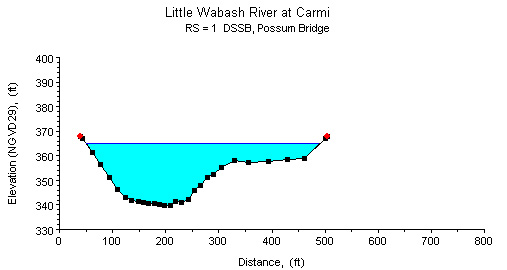
Study Reach.--The channel reach is natural and meandering. The study reach, approximately 2.9 miles long, extends from the Main Street Bridge in Carmi to Possum Bridge, as shown in the quadrangle map on the top left. Four surveyed cross sections (surveyed by the Illinois Department of Transportation (survey date unknown) and the U.S. Geological Survey in April 1993) are available at this site for evaluating the channel geometries (see plots above). The channel alignment, approximate variations in channel width and bank conditions, and locations of cross sections are shown in the aerial photograph on the top right.
Gage Location.--Lat 38°03'40", long 88°09'35", in NW1/4 SE1/4 sec.25, T.5S., R.9E., White County, Hydrologic Unit 05120114, on the right bank at the downstream side of Possum Bridge, 2.3 mi south of the Main Street Bridge in Carmi and 7.8 mi downstream from Skillet Fork. The base gage can be reached by driving about 1-3/4 mi south on the oiled road extension of Church Street in Carmi. The auxiliary gage is located at lat 38� 05� 32�, long 88 09� 22�, in NE1/4 sec. 13, T.5 S., R. 9 E., White County, at the Main Street Bridge in Carmi, and 5.0 mi downstream from Skillet Fork. The USGS streamgage station number for the base gage is 03381500.
Drainage Area.--3,102 sq mi.
Gage Datum and Elevations of Reference Points.--This is a slope station site where the auxiliary gage is located at the Main Street bridge 2.8 mi upstream from the base gage. Datum of both the base and auxiliary gages is 339.91 ft. A wire-weight gage (WWG) is located on the downstream handrail of the Main Street bridge at the upstream auxiliary station. Prior to the installation of the auxiliary station WWG, a reference point (RP-9) was used to measure stage. RP-9 is the head of a bolt located 30 ft from the gagehouse on the downstream side of the Main Street bridge, elevation=385.249 ft. A WWG is attached to the downstream side of Possum Bridge at the base gage. All elevations are referenced to NGVD29.
Stage, Discharge Measurements, and Computed n-Values.--Stage and discharge data for the n-values study were retrieved from measured discharge records for this slope station site. Water surface elevations were measured upstream at RP-9 or the WWG and at the downstream WWG before and after each discharge measurement. Discharge measurements were made using the conventional current-meter method. The computed n-values are listed in the following table. Whenever possible, the computed n-values are associated with a photograph taken at the time of the measurement. The photographs are arranged from low to high discharge in order to illustrate the contributing factors of n-values at a particular discharge.
| Date of Observation | Discharge (ft3/s) | Average Cross Section Area (ft2) | Hydraulic Radius (ft) | Mean Velocity (ft/s) | Slope (ft/ft) | Coefficient of Roughness n |
|---|---|---|---|---|---|---|
| 2/18/1992 | 1560.0 | 862.5 | 5.44 | 2.15 | 0.000079 | 0.034 |
| 7/16/1997 | 1940.0 | 1092.0 | 6.50 | 2.02 | 0.000077 | 0.036 |
| 8/28/1989 | 2470.0 | 1429.2 | 7.96 | 1.88 | 0.000076 | 0.039 |
| 12/13/1974 | 3890.0 | 1984.6 | 10.06 | 2.05 | 0.000081 | 0.038 |
| 2/21/2002 | 4610.0 | 2063.8 | 10.34 | 2.33 | 0.000091 | 0.035 |
| 1/6/1992 | 4740.0 | 2203.9 | 10.81 | 2.23 | 0.000079 | 0.035 |
| 4/25/1990 | 5810.0 | 2825.2 | 12.36 | 2.10 | 0.000075 | 0.038 |
| 11/18/1992 | 6530.0 | 3256.0 | 11.34 | 2.02 | 0.000077 | 0.036 |
| 1/6/1988 | 8310.0 | 4055.7 | 11.94 | 2.05 | 0.000088 | 0.039 |
| 6/17/2003 | 9140.0 | 4725.4 | 12.76 | 1.93 | 0.000093 | 0.043 |
| 1/14/1975 | 10200.0 | 5647.9 | 13.97 | 1.81 | 0.000100 | 0.050 |
| 6/2/2004 | 11800.0 | 5812.8 | 14.19 | 2.03 | 0.000095 | 0.043 |
| 6/30/2000 | 12100.0 | 5889.6 | 14.28 | 2.06 | 0.000104 | 0.045 |
| 2/4/1997 | 13100.0 | 6924.6 | 14.08 | 1.93 | 0.000097 | 0.044 |
.JPG)
.JPG)
.JPG)
.JPG)
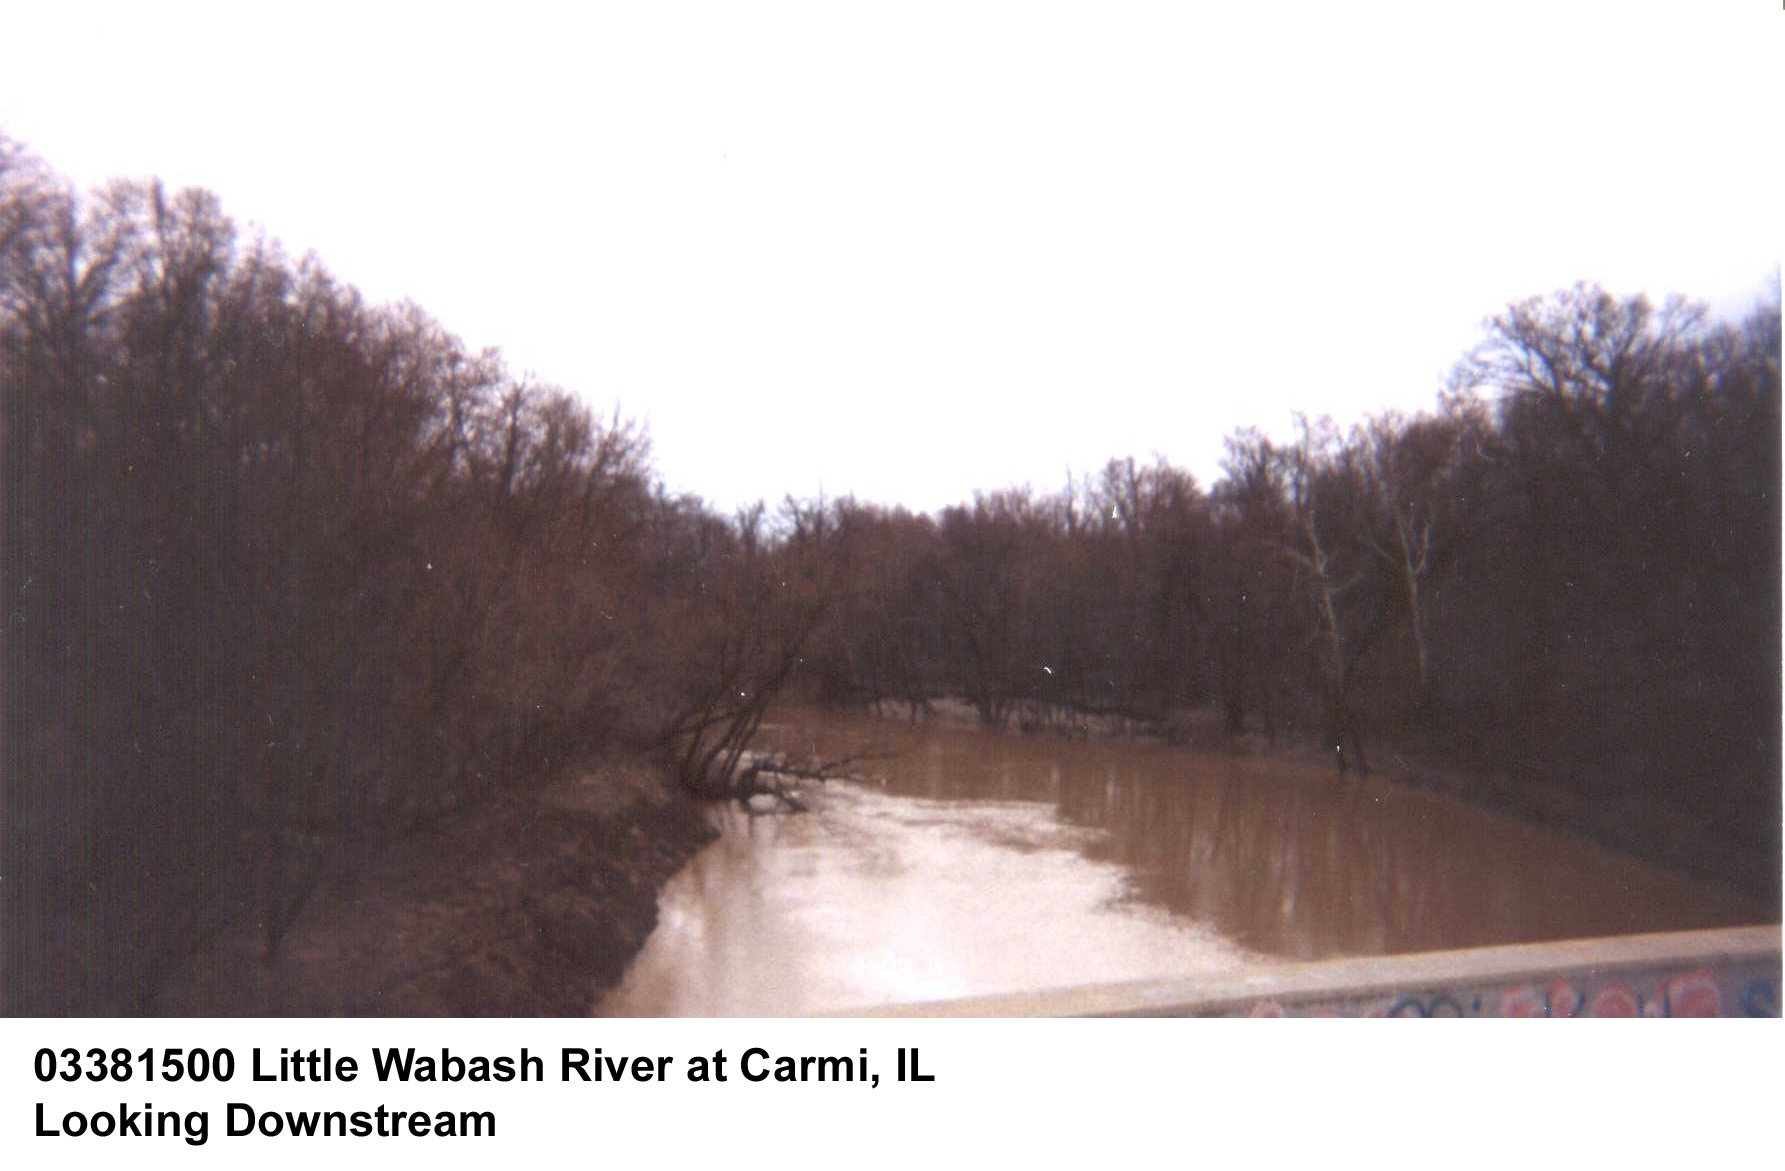
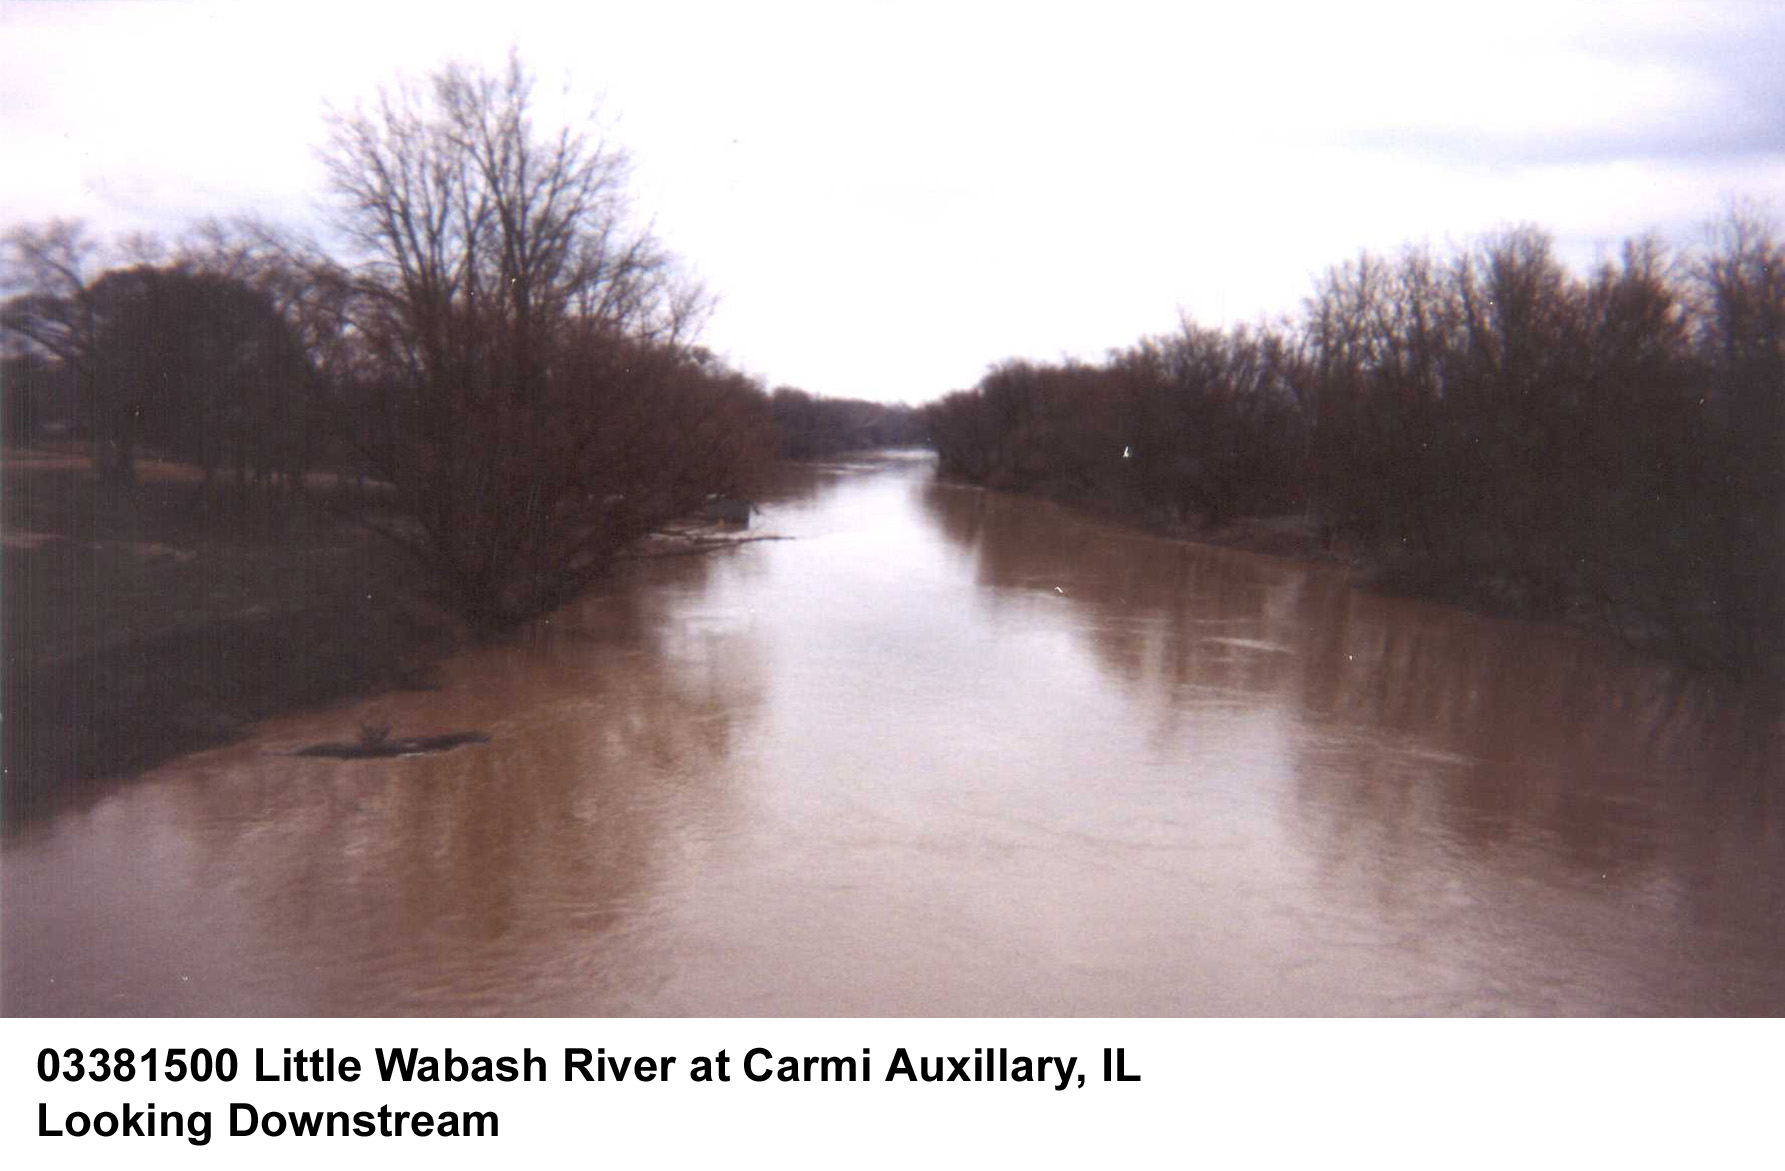
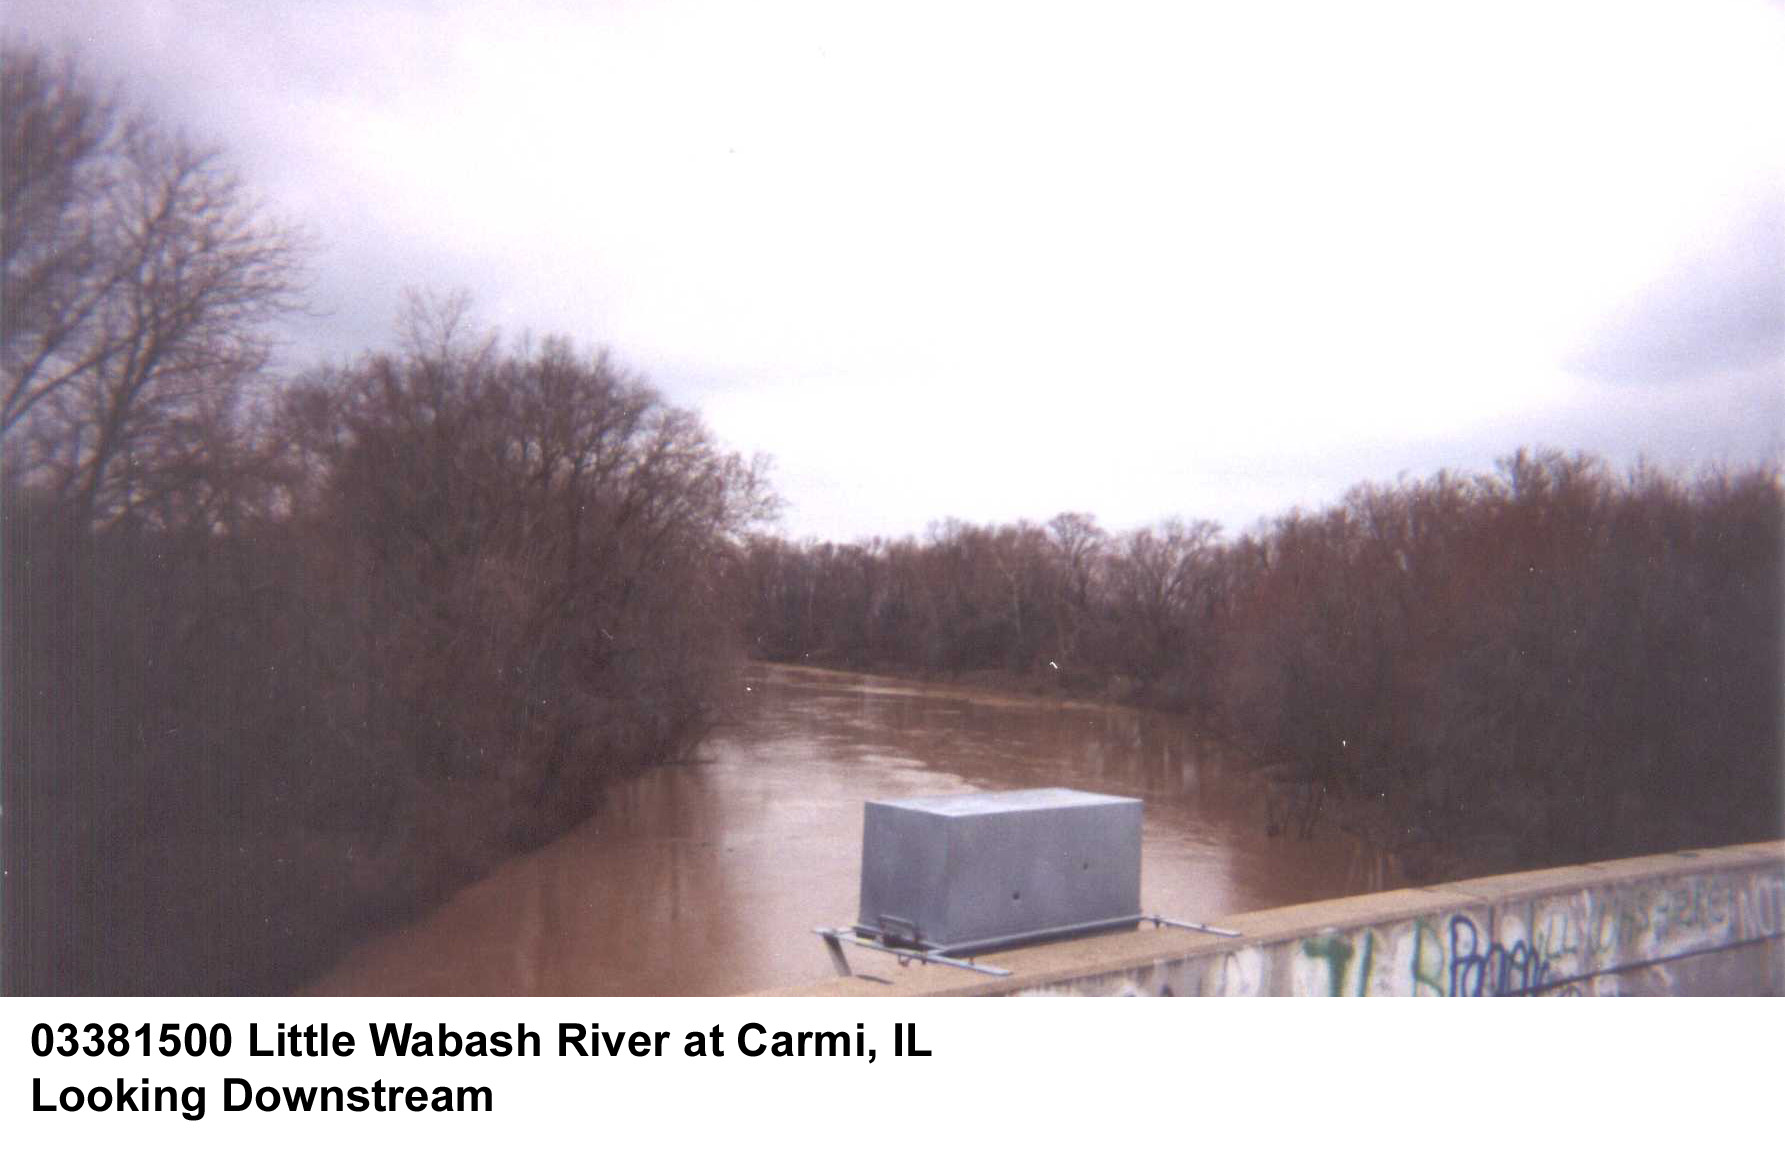
Description of Channel.--This stream is a natural channel. The streambed is composed of smooth rock and gravel, free of vegetation. The bank face is a clay and sand mixture, covered with exposed tree roots, brush and weeds. Overflow occurs at a stage of about 30 ft, so measurements used in this study did not exceed a stage of 30 ft. The study reach can be described as having a slight meander.
Floods.--Maximum stage known 36.70 feet May 13, 1961. Flood of January 1937, 36.23 feet. Flood of May 25, 1943, 34.20 ft. Flood of Jan. 11, 1950, 35.23 ft. Flood of May 23, 1990, 34.38 ft.

![]() U.S. Department of the Interior |
U.S. Geological Survey
U.S. Department of the Interior |
U.S. Geological Survey
URL: http://il.water.usgs.gov/proj/nvalues/db/sites/03381500.shtml[an error occurred while processing this directive]?
Page Contact Information: David Soong
Page Last Modified: February 4, 2013
