

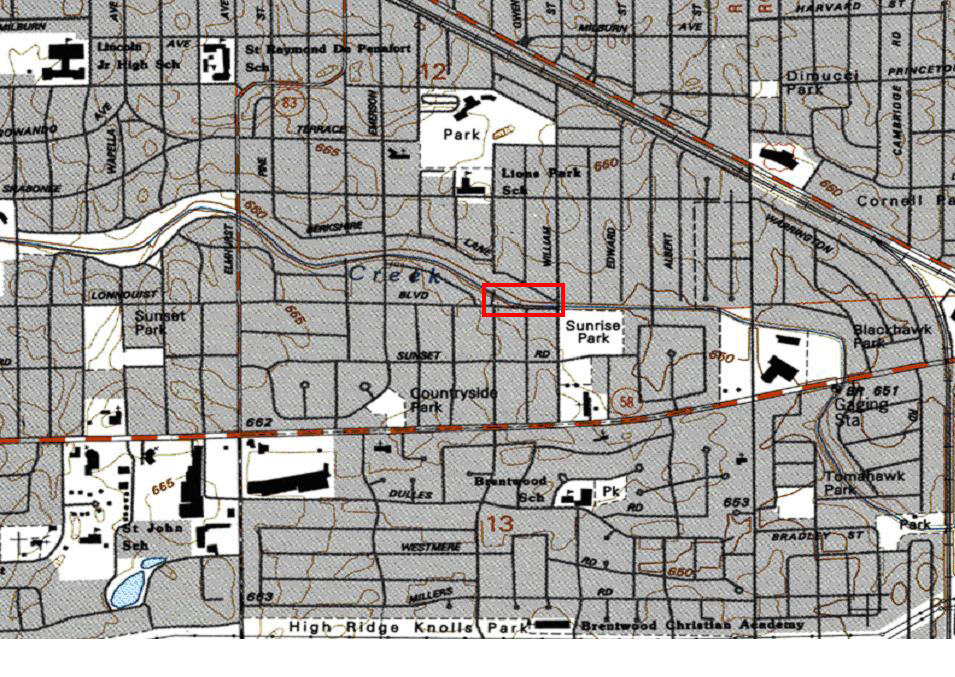
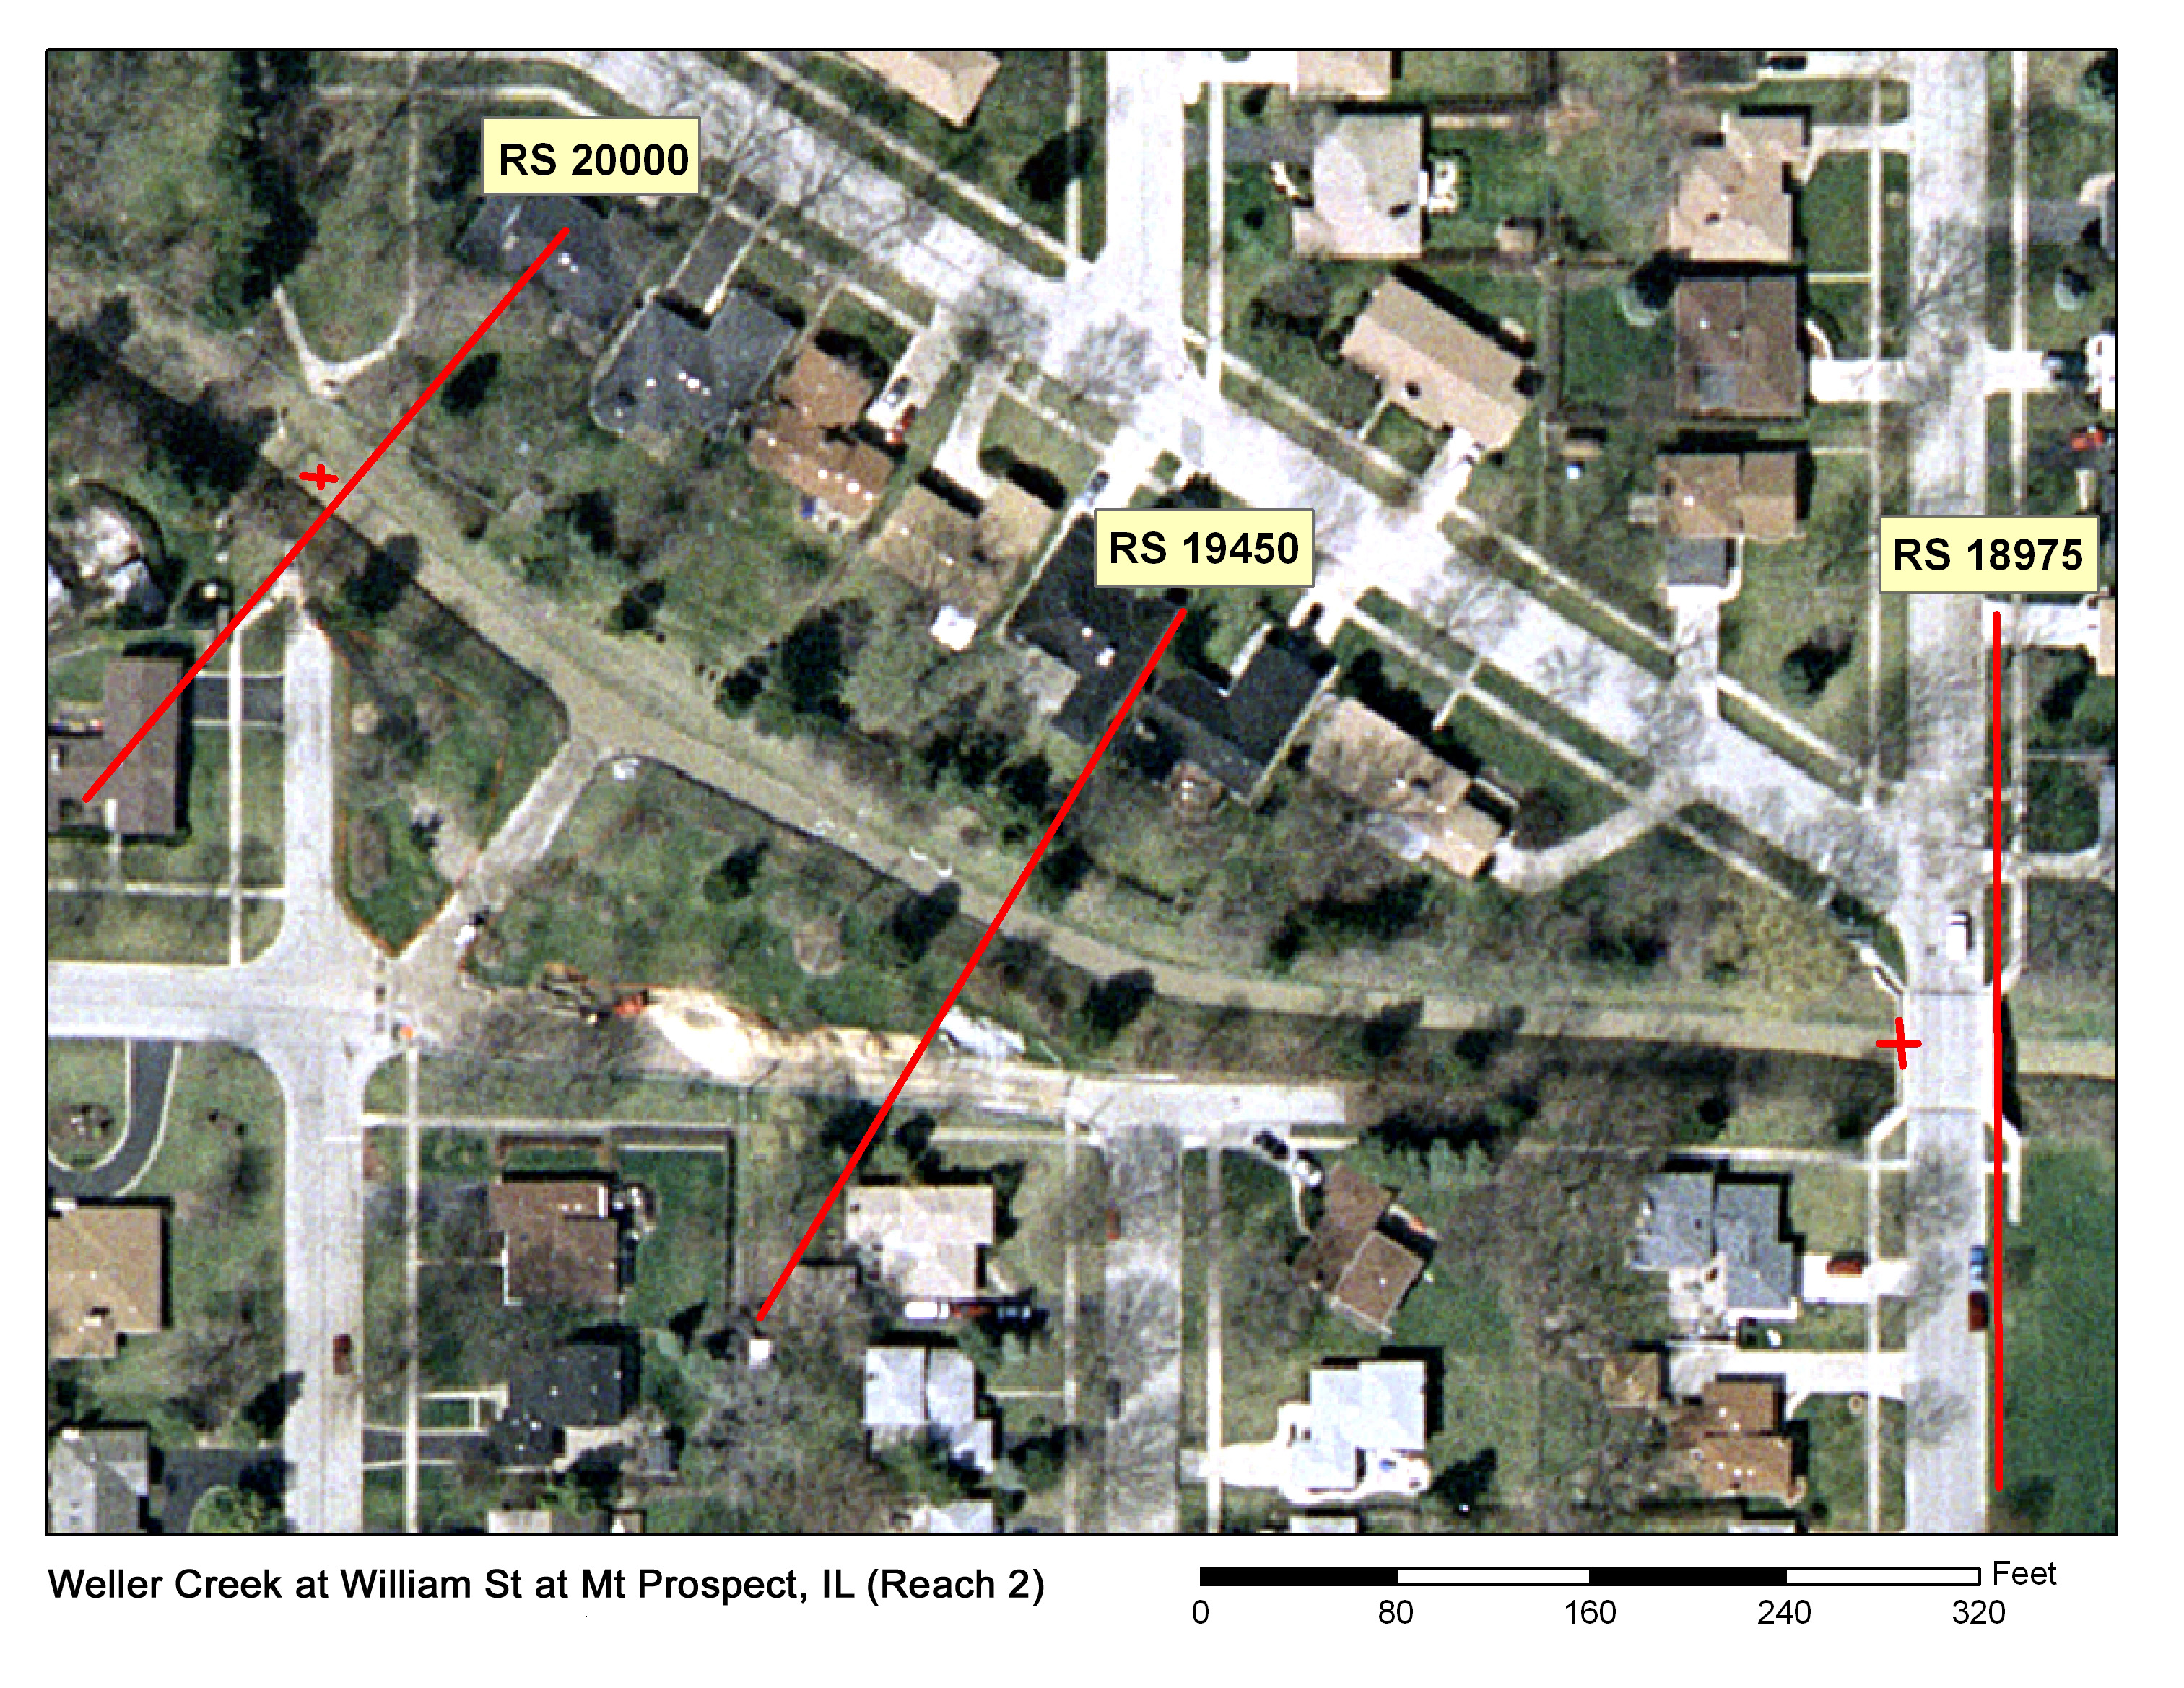
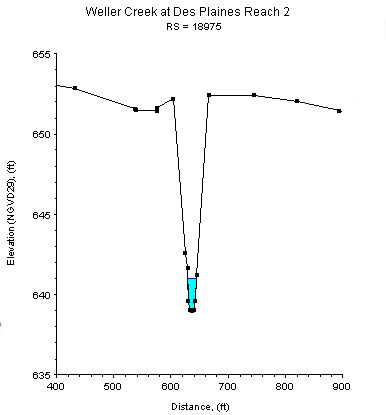
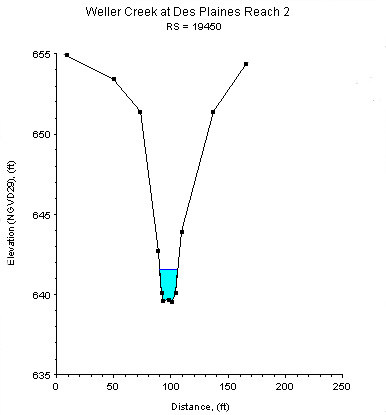
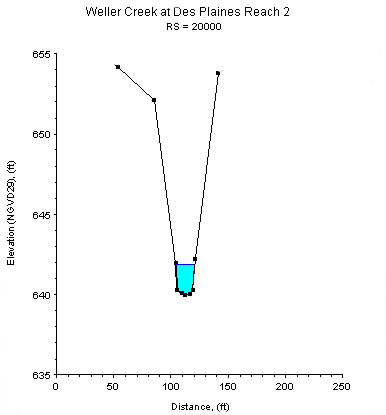
Study Reach.--The channel reach is a constructed channel in an urban setting, as shown on the quadrangle map at the top left. The study reach, about 730 ft long, is located from just upstream of the South School Street bridge to the South William Street bridge. Three surveyed cross sections (surveyed by the U.S. Corps of Engineers in May 2003) are available for describing the channel geometries in the study reach. The channel alignment, approximate variations in channel width and bank conditions, and locations of cross sections are shown in the aerial photograph on the top right. Cross-sectional plots at three river stations (RSs), as shown above, are selected to illustrate the variation in cross-sectional geometry.
Gage Location.--The location where discharge measurements are taken is lat 42°03’06”, long 87°55’43”. The study reach is located at SW1/4 SW1/4 SE1/4 sec.12, T.41N., R.11E., Cook County, Hydrologic Unit 07120004, on the right bank 10 ft upstream from the bridge on State Highway 58 (Golf Road) in Des Plaines, 2 mi west of US Highway 45 and at river mile 3.8. The USGS streamgage station number is 05529990.
Drainage Area.--12.69 sq mi.
Gage Datum and Elevations of Reference Points.--Datum of the gage is 634.02 ft. RP-4 is two filemarks on the upstream side of the bridge deck frame accessed through an opening in the bridge deck catwalk located just under the "X" formed by the guardrail diagonals on the School Street pedestrian bridge, elevation = 654.999 ft. RP-3 is a bolt in the concrete guardrail on the upstream side of the South Williams Street bridge located about midchannel, elevation = 656.515 ft. All elevations are referenced to NGVD29.
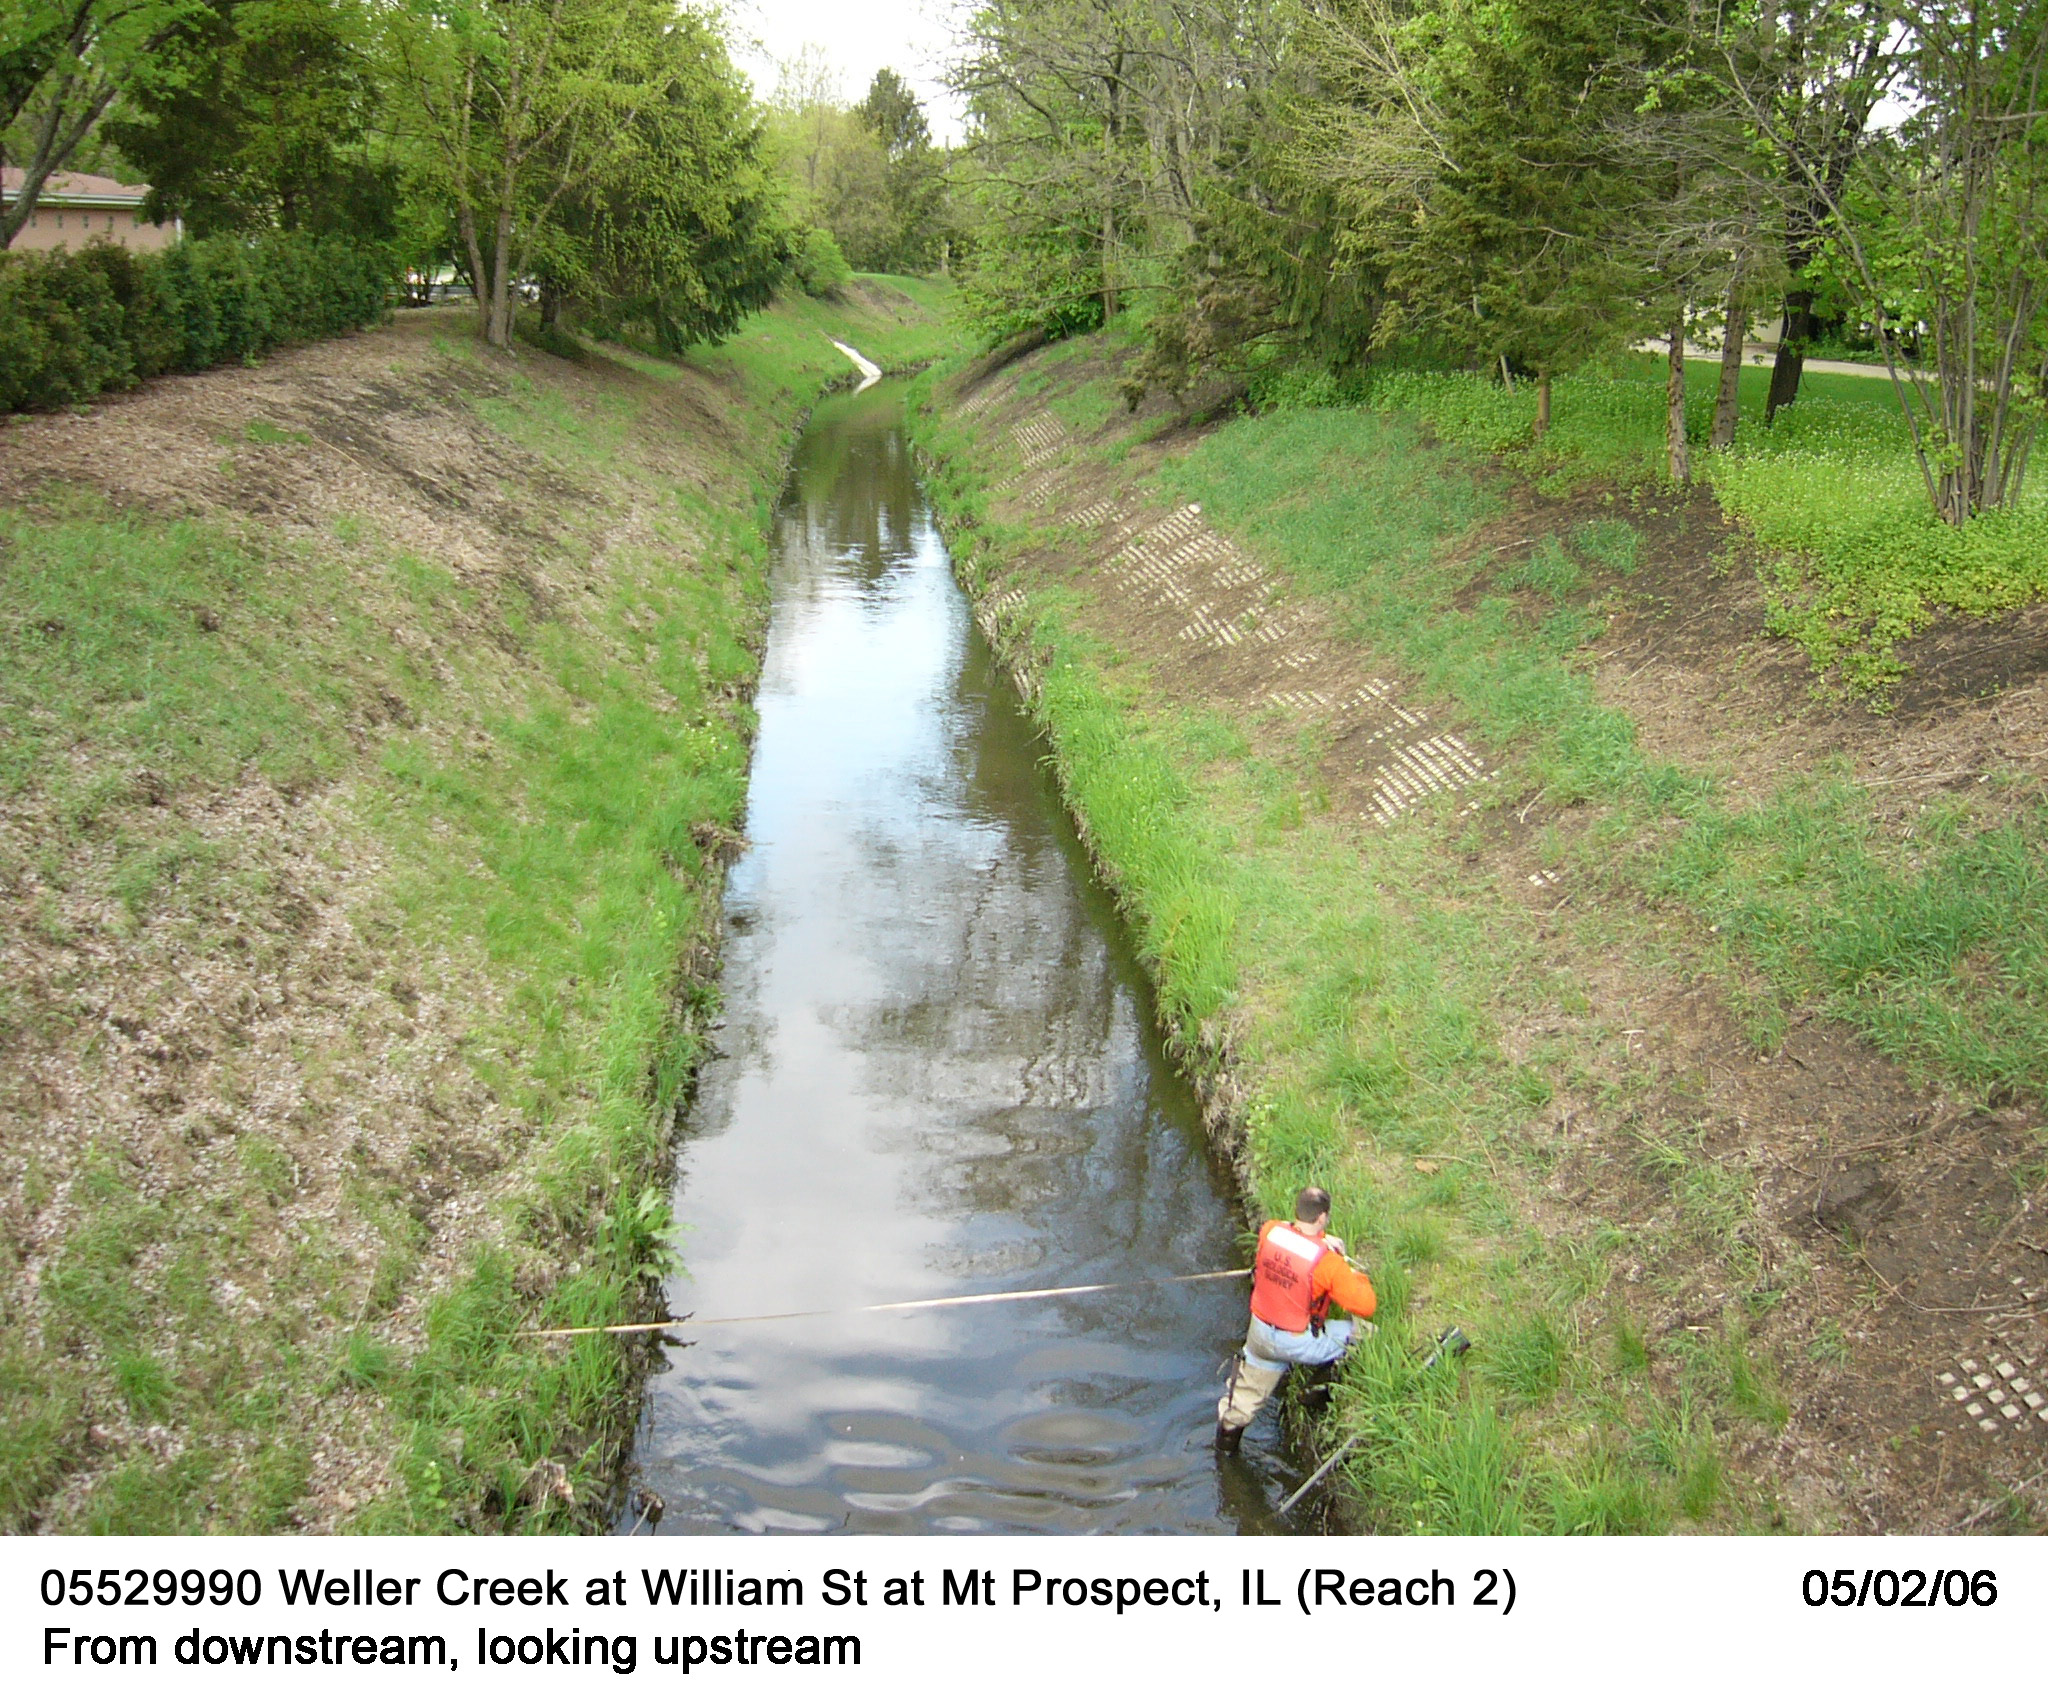
Stage, Discharge Measurements, and Computed n-Values.--Water surface elevations are made by taping down from RP-3 on the upstream side of the Williams Street bridge and from RP-4 on the upstream side of the School Street pedestrian bridge. Discharge measurements are made on the upstream side of the Williams Street Bridge or by wading in the vicinity of the upstream side of the bridge. When possible, multiple discharge measurements were made during a rise and recession to provide data for calculating n-values over a range in stage. The computed n-values are listed in the following table. Whenever possible, the computed n-values are associated with a photograph taken at the time of the measurement. The photographs are arranged from low to high discharge in order to illustrate the contributing factors of n-values at a particular discharge.
| Date of Observation | Discharge (ft3/s) | Average Cross Section Area (ft2) | Hydraulic Radius (ft) | Mean Velocity (ft/s) | Slope (ft/ft) | Coefficient of Roughness n |
|---|---|---|---|---|---|---|
| 5/2/2006 | 8.1 | 8.2 | 0.60 | 1.00 | 0.000999 | 0.029 |
| 4/25/2007 | 59.1 | 23.5 | 1.41 | 2.52 | 0.001358 | 0.024 |
| 4/25/2007 | 62.4 | 24.7 | 1.46 | 2.54 | 0.001382 | 0.024 |
| 6/26/2006 | 63.7 | 27.7 | 1.58 | 2.32 | 0.001542 | 0.029 |
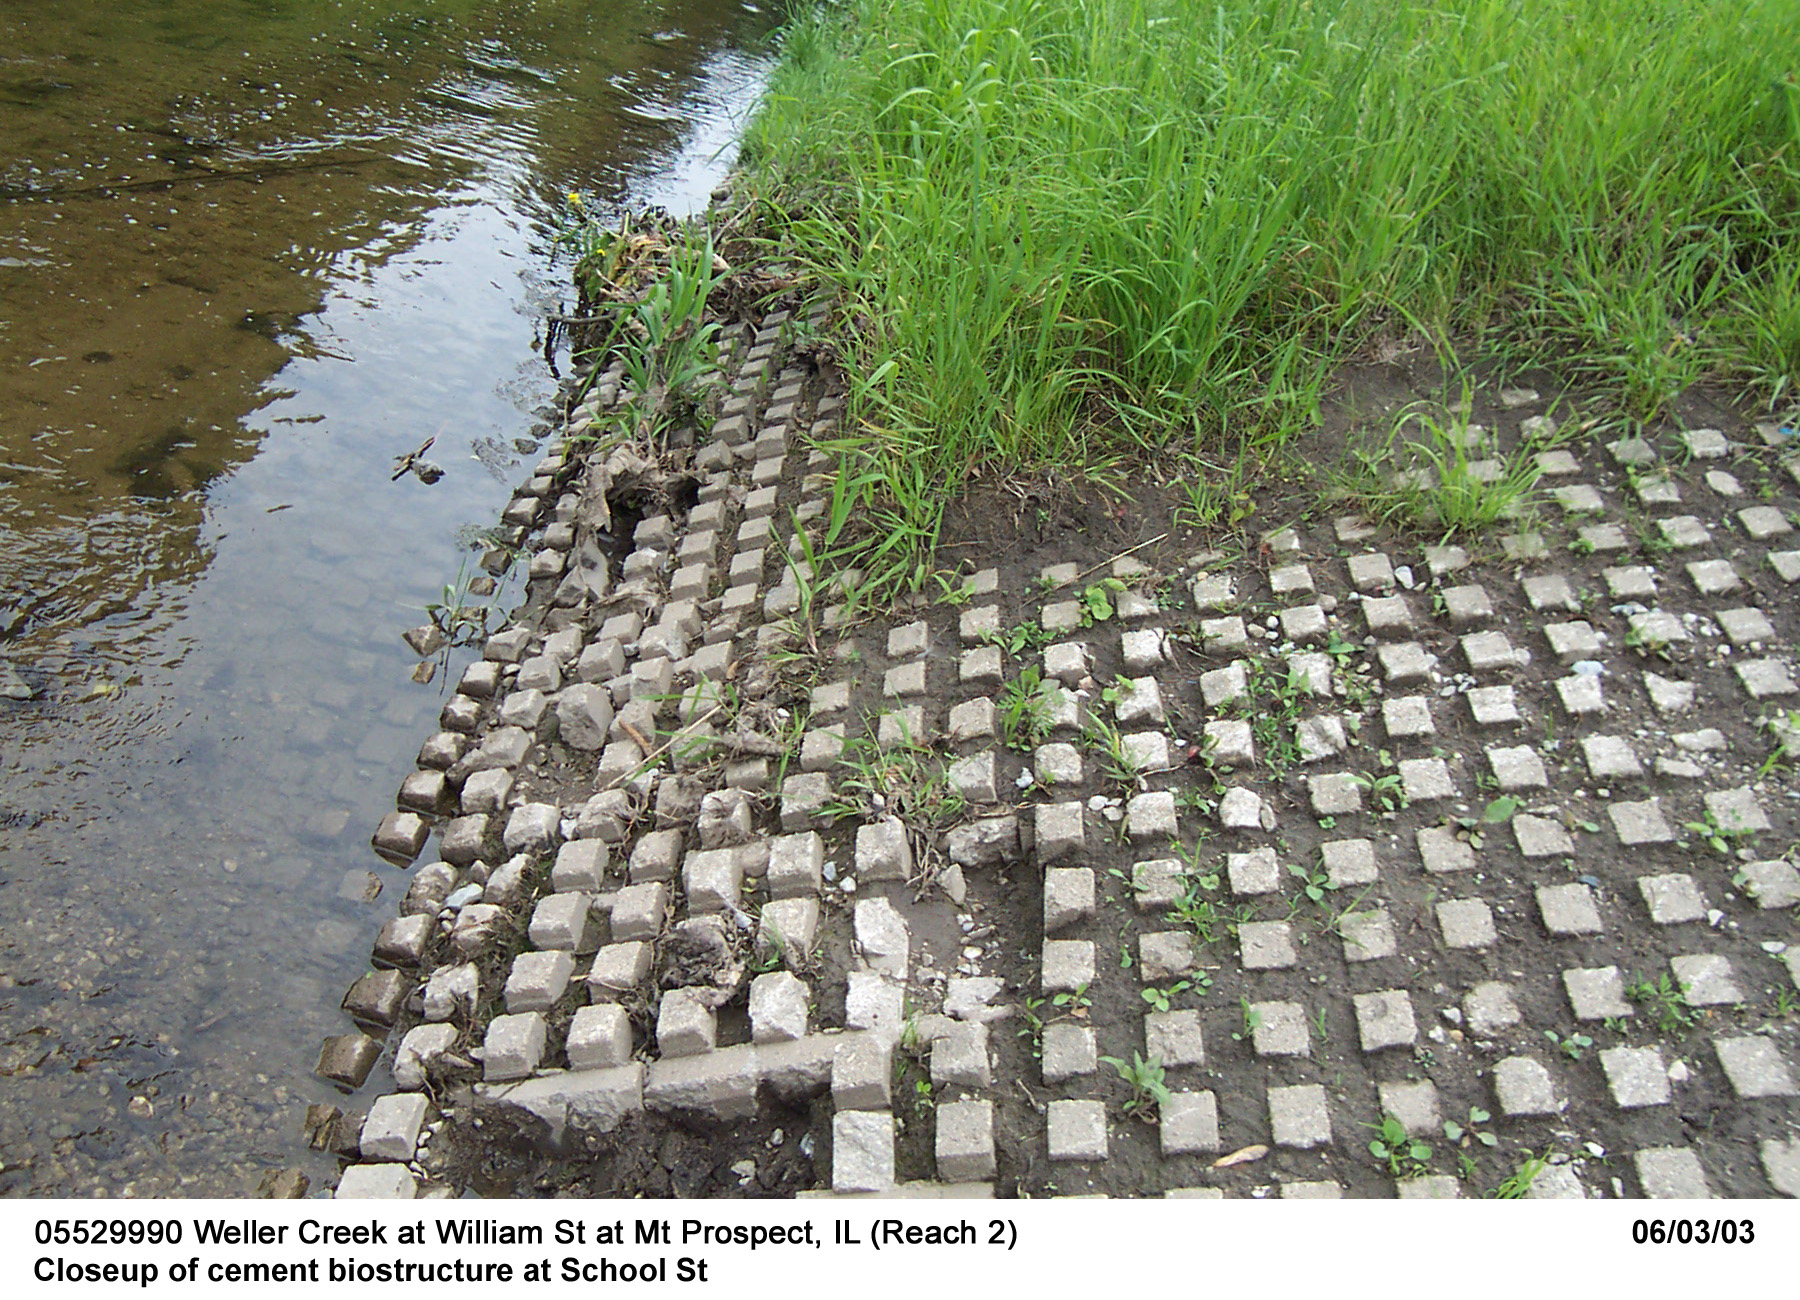
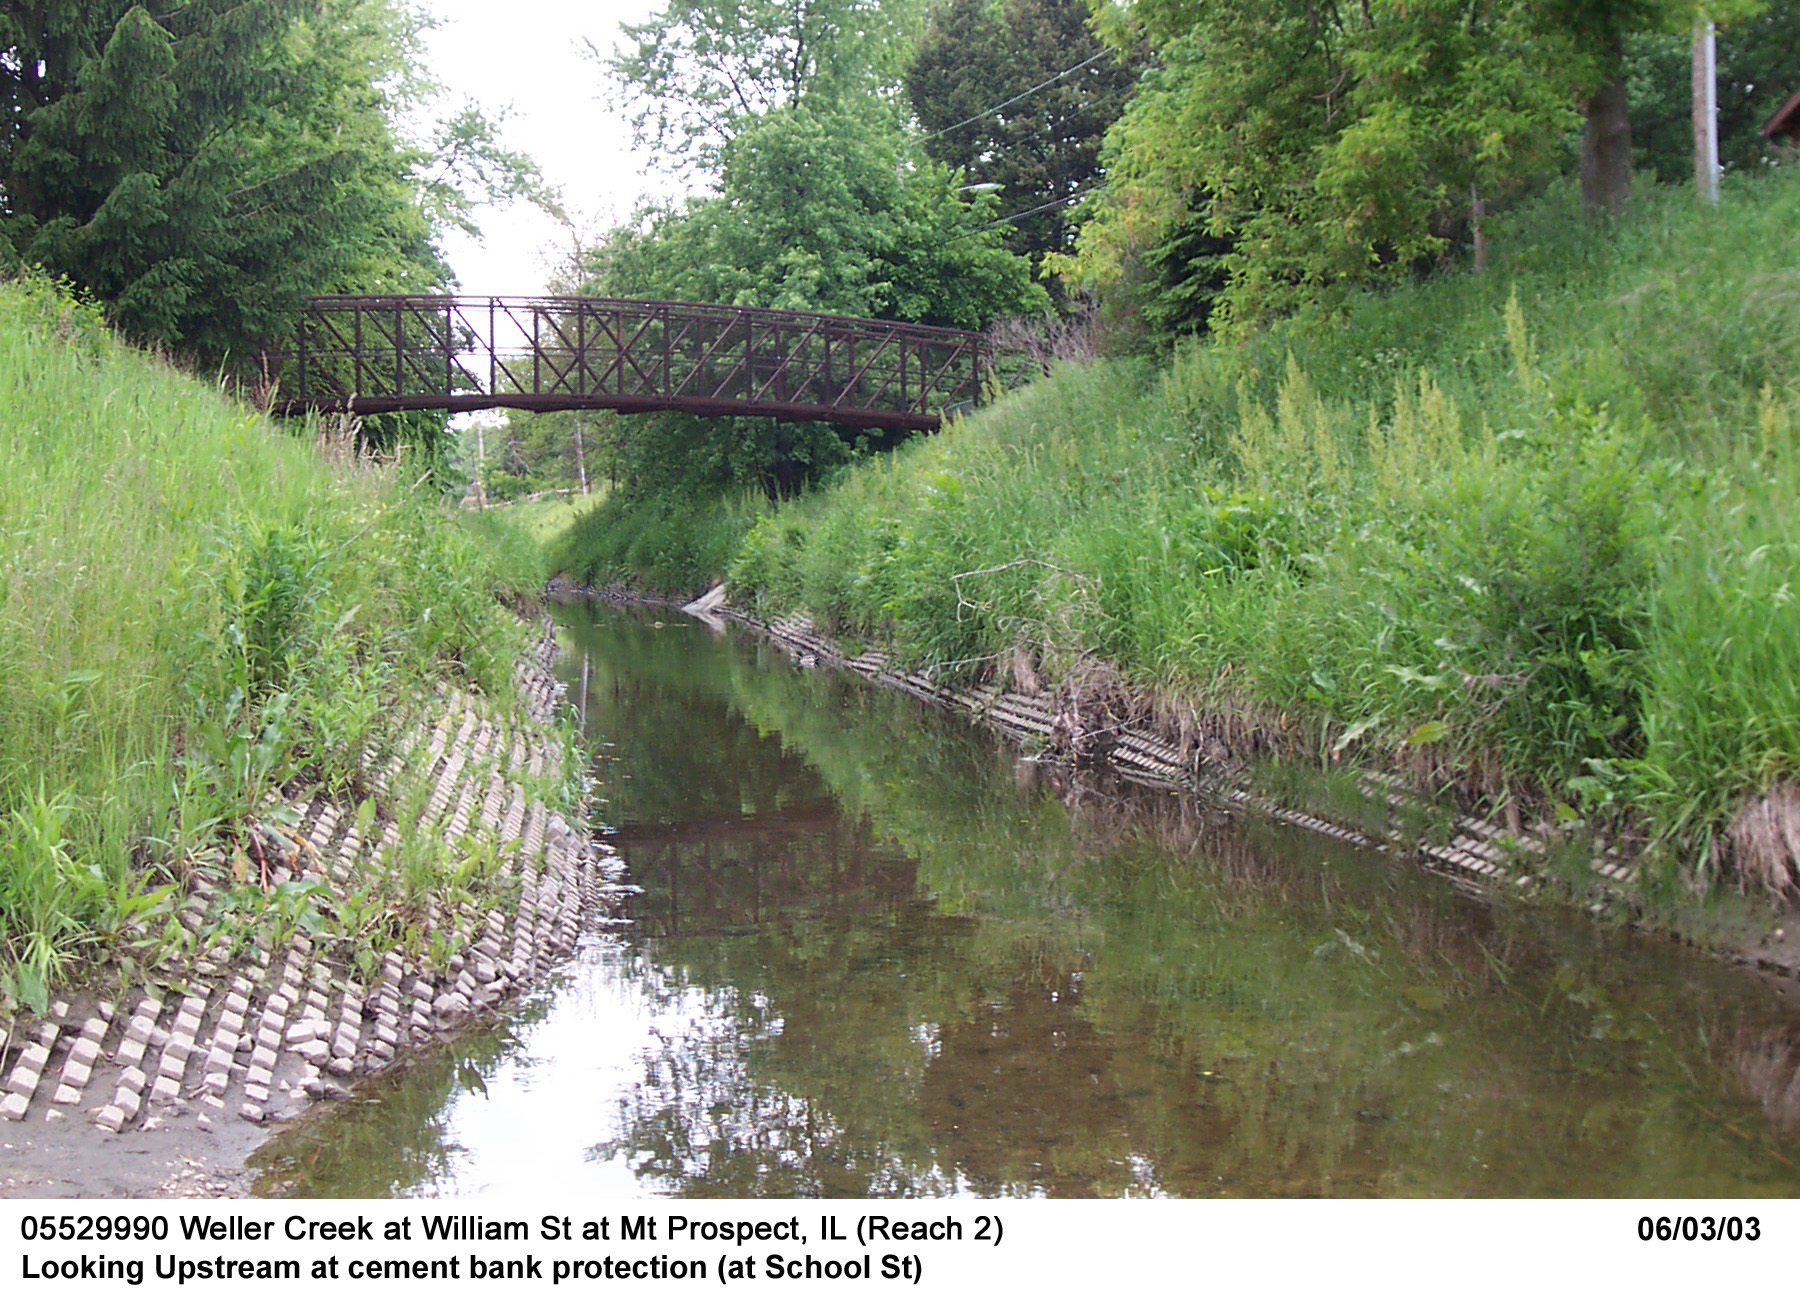
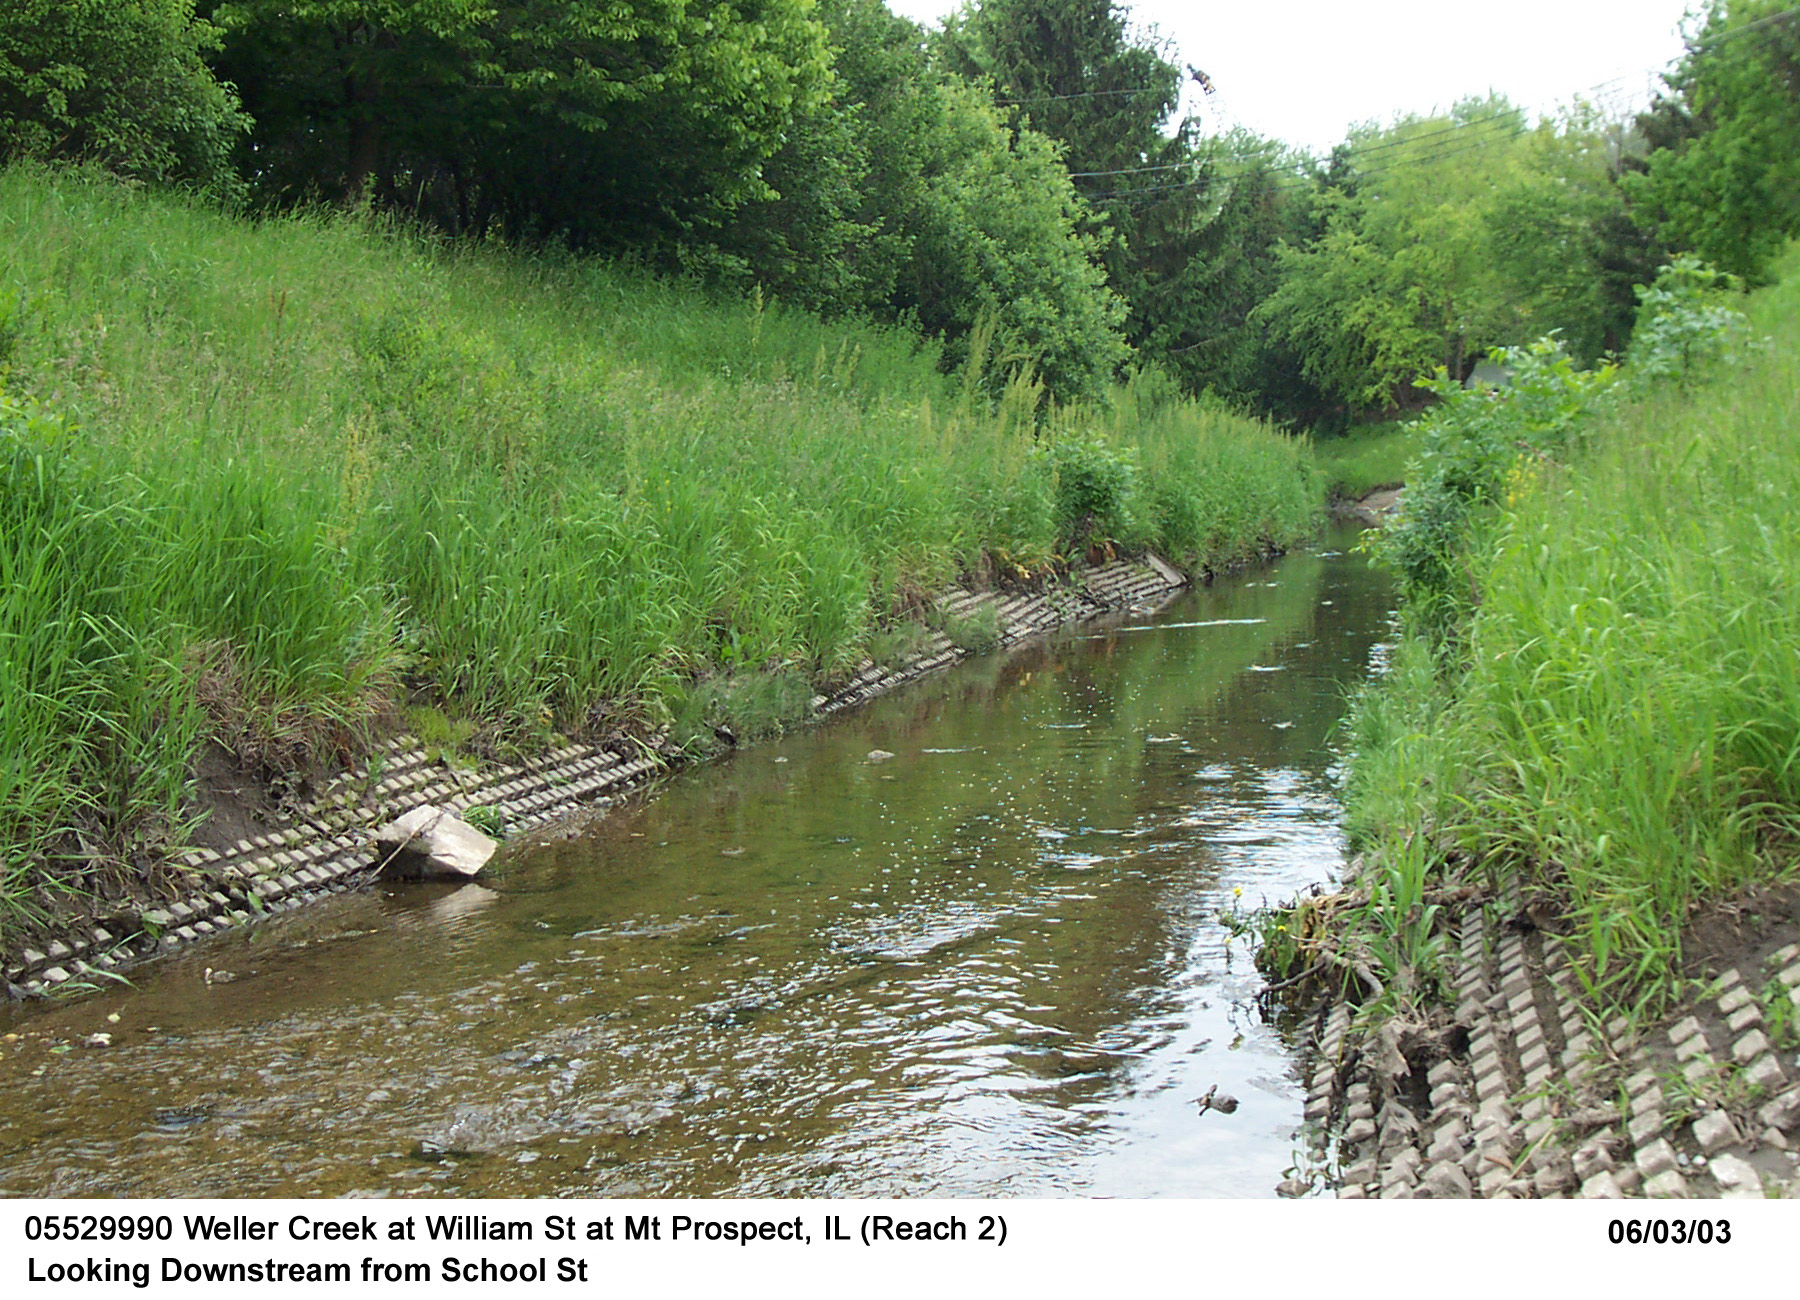
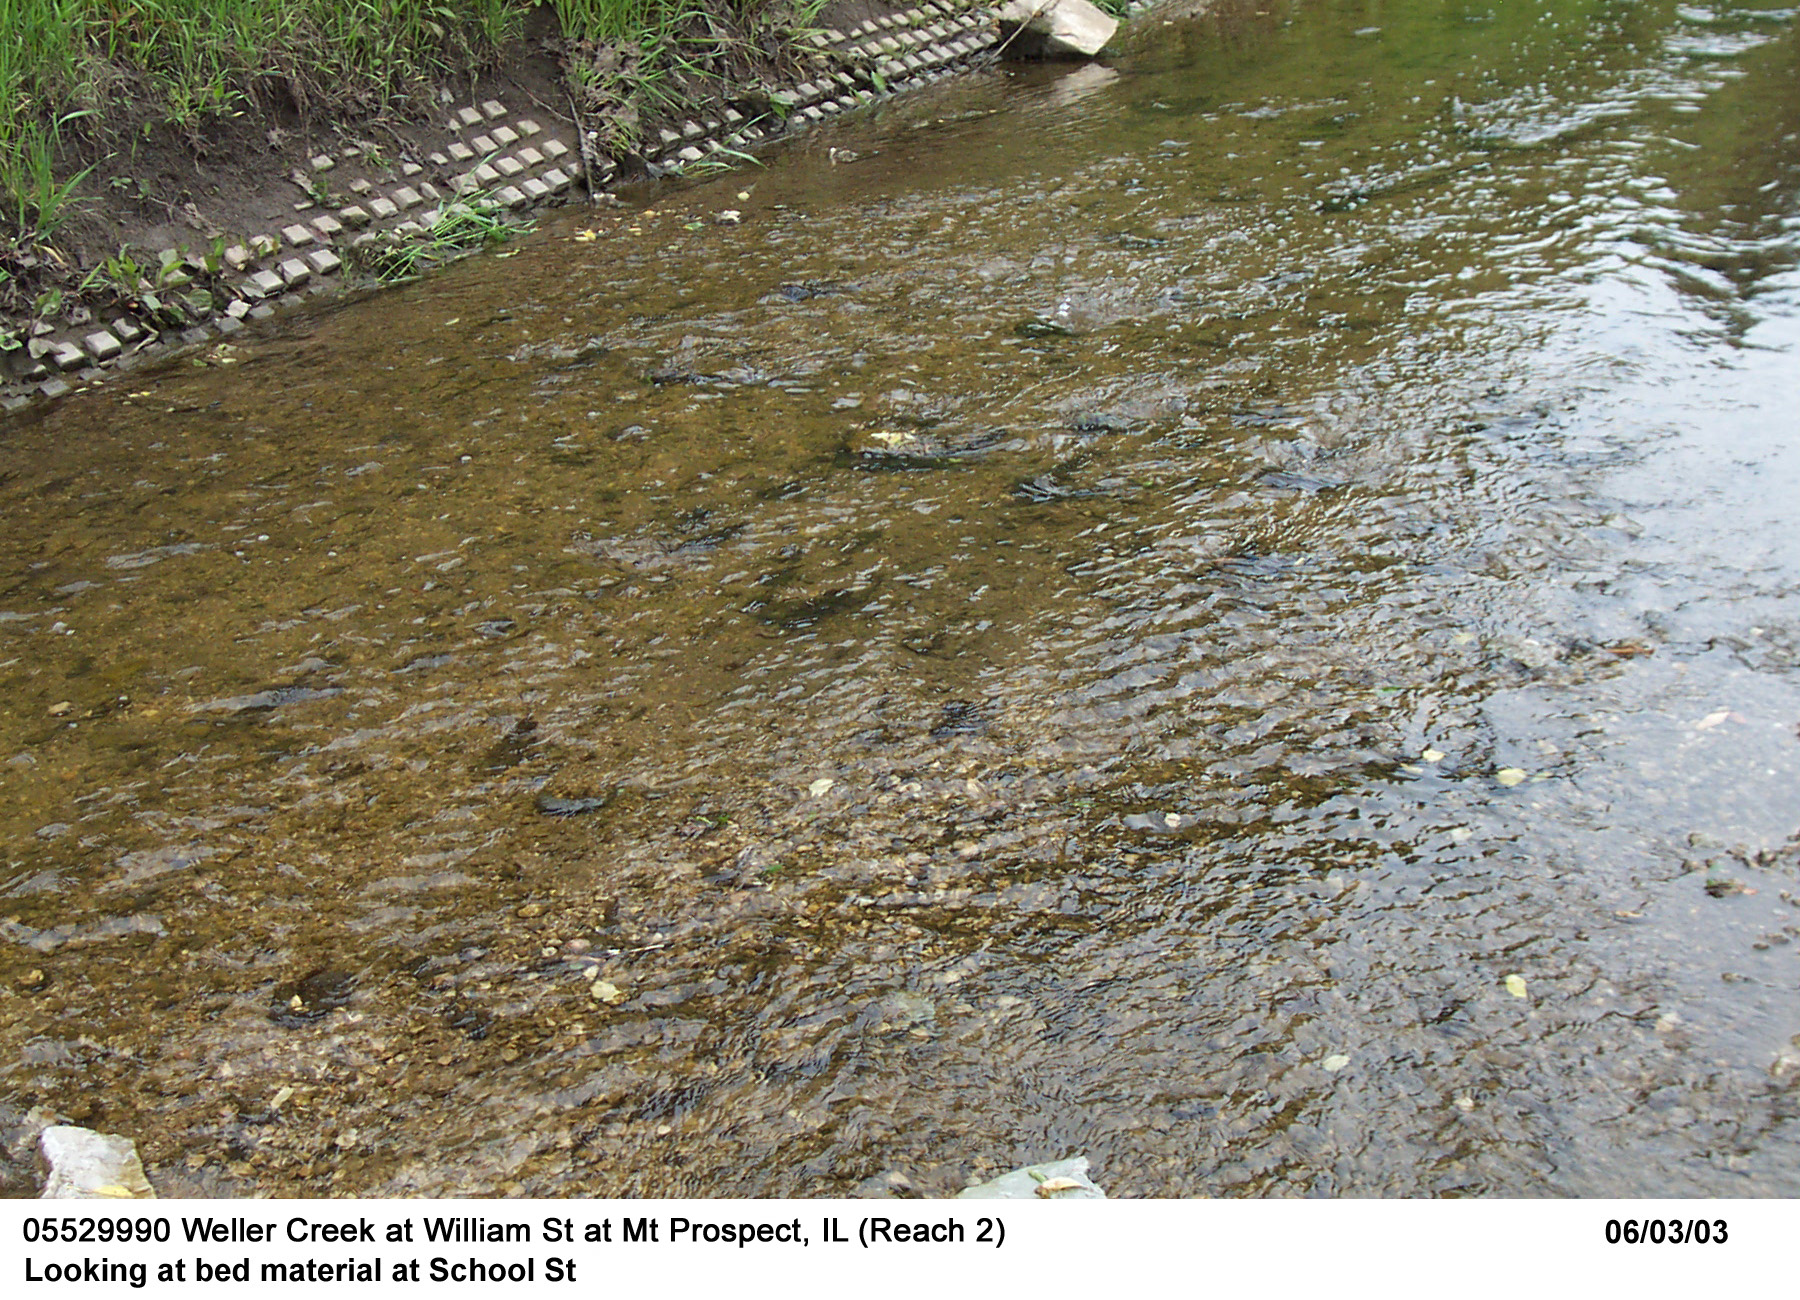
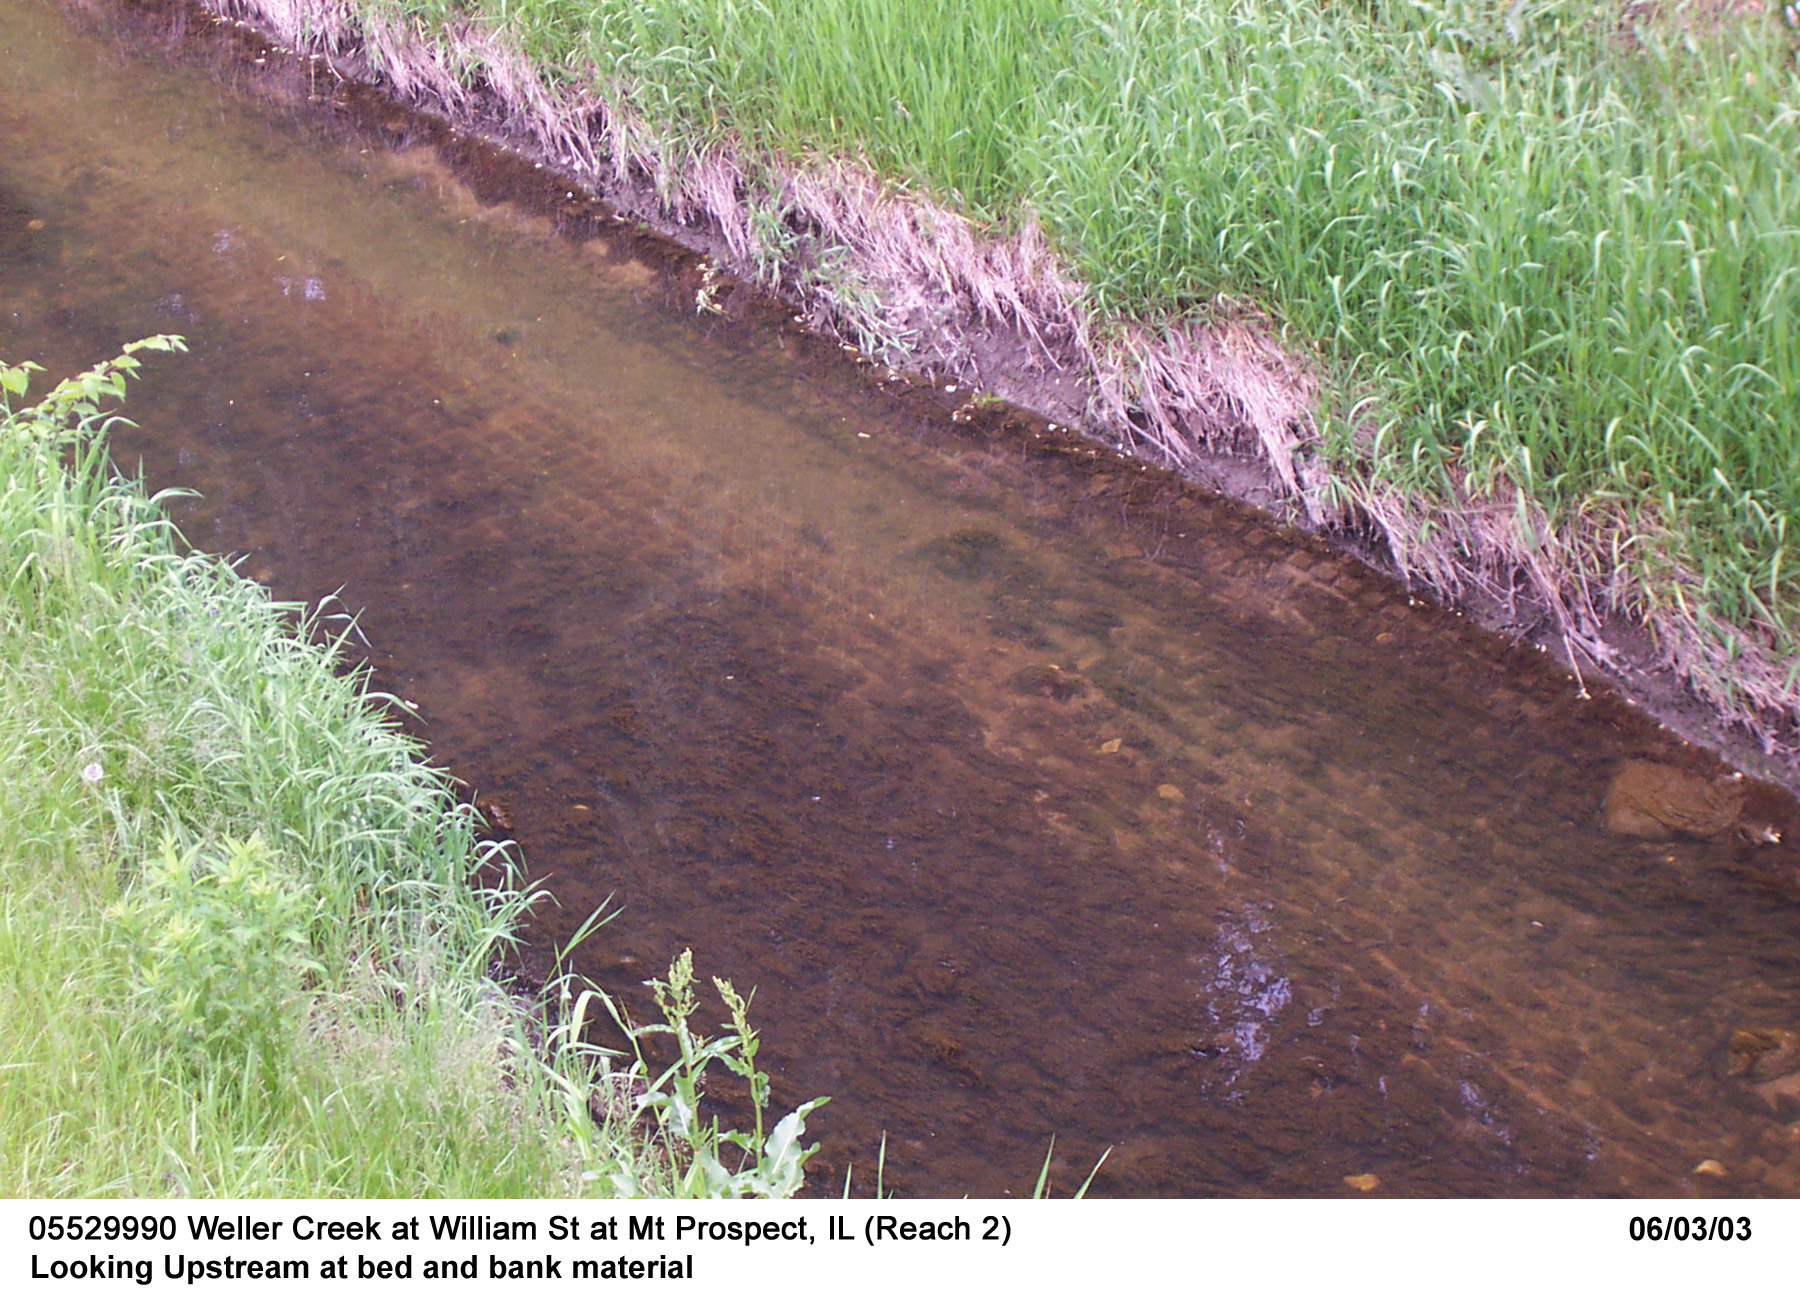
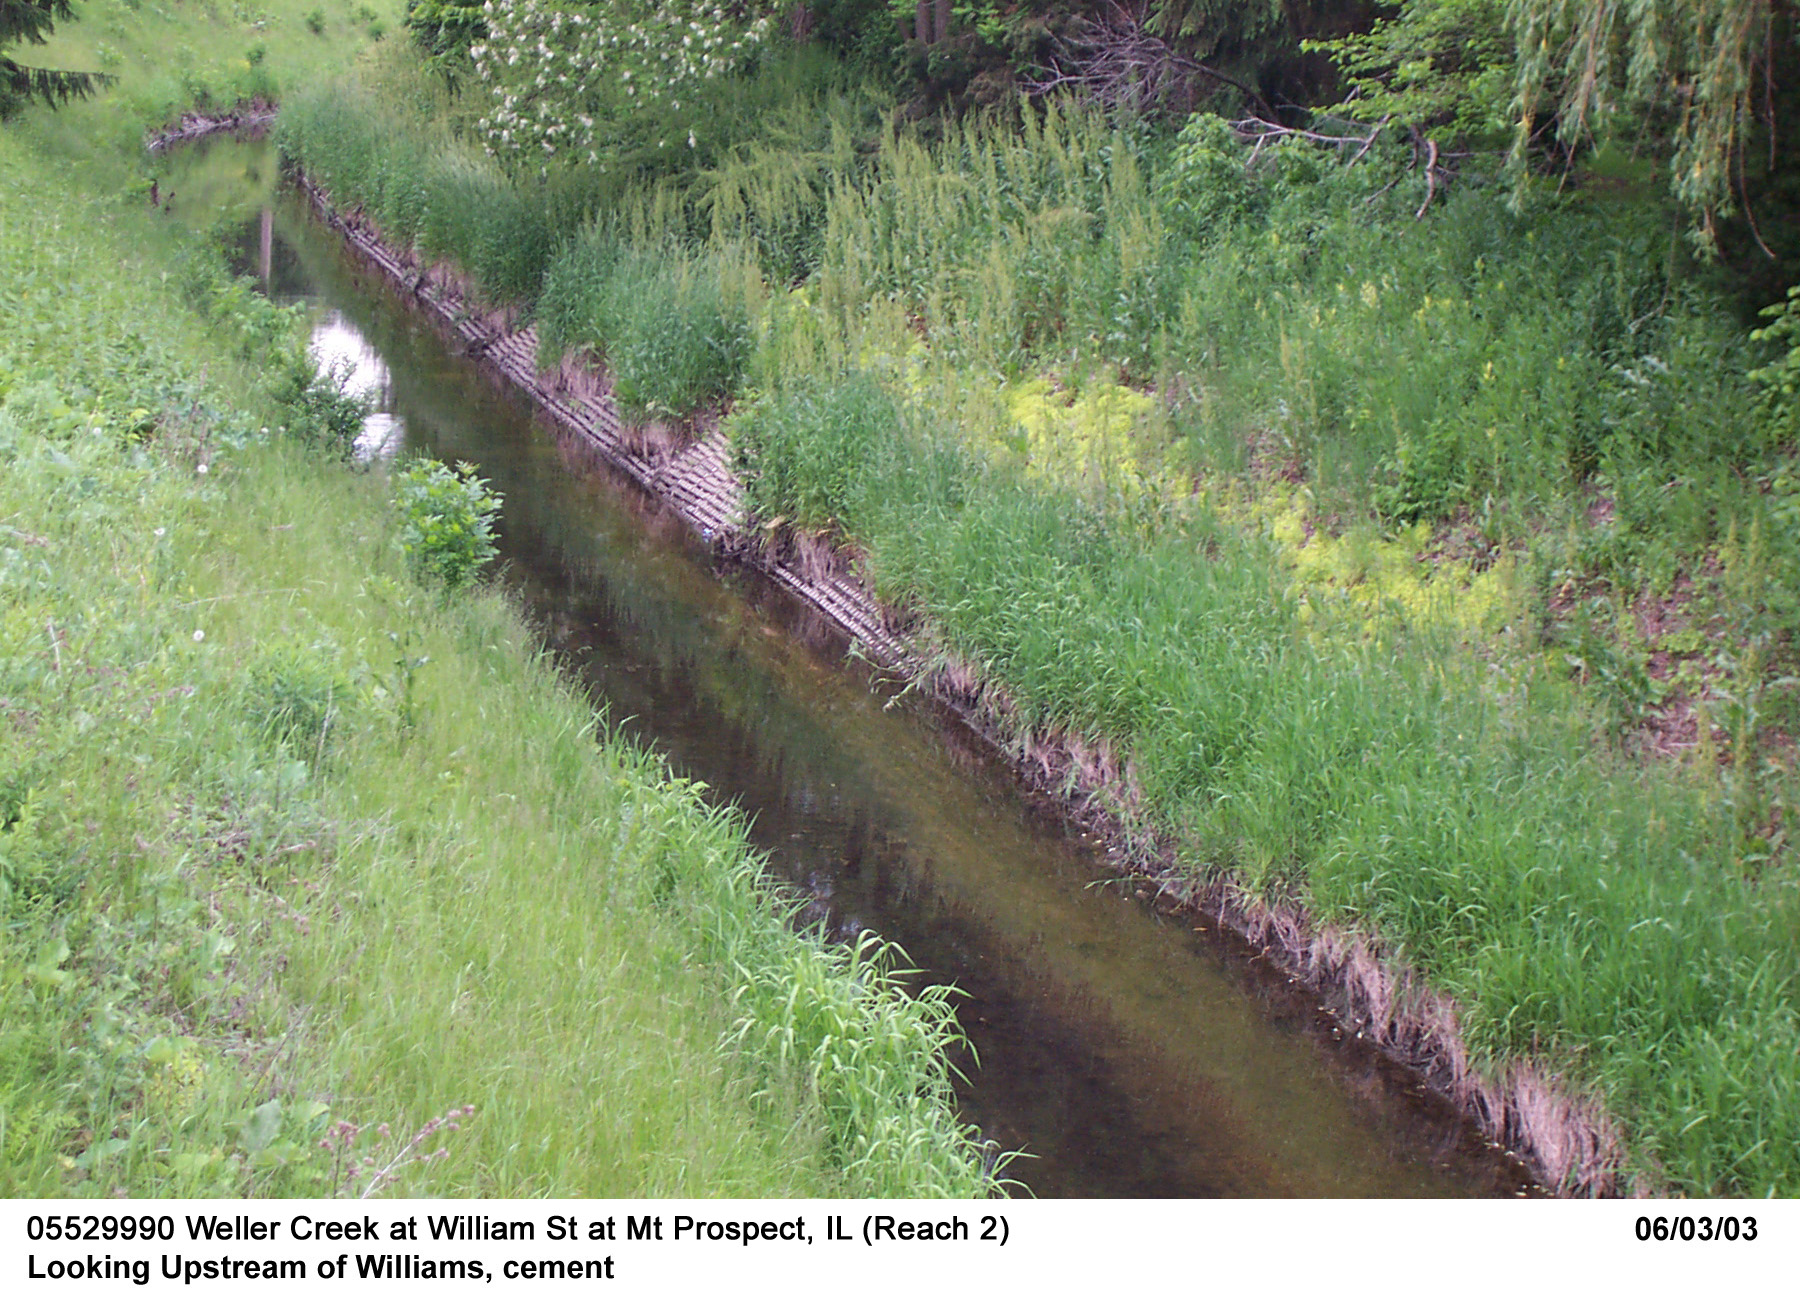
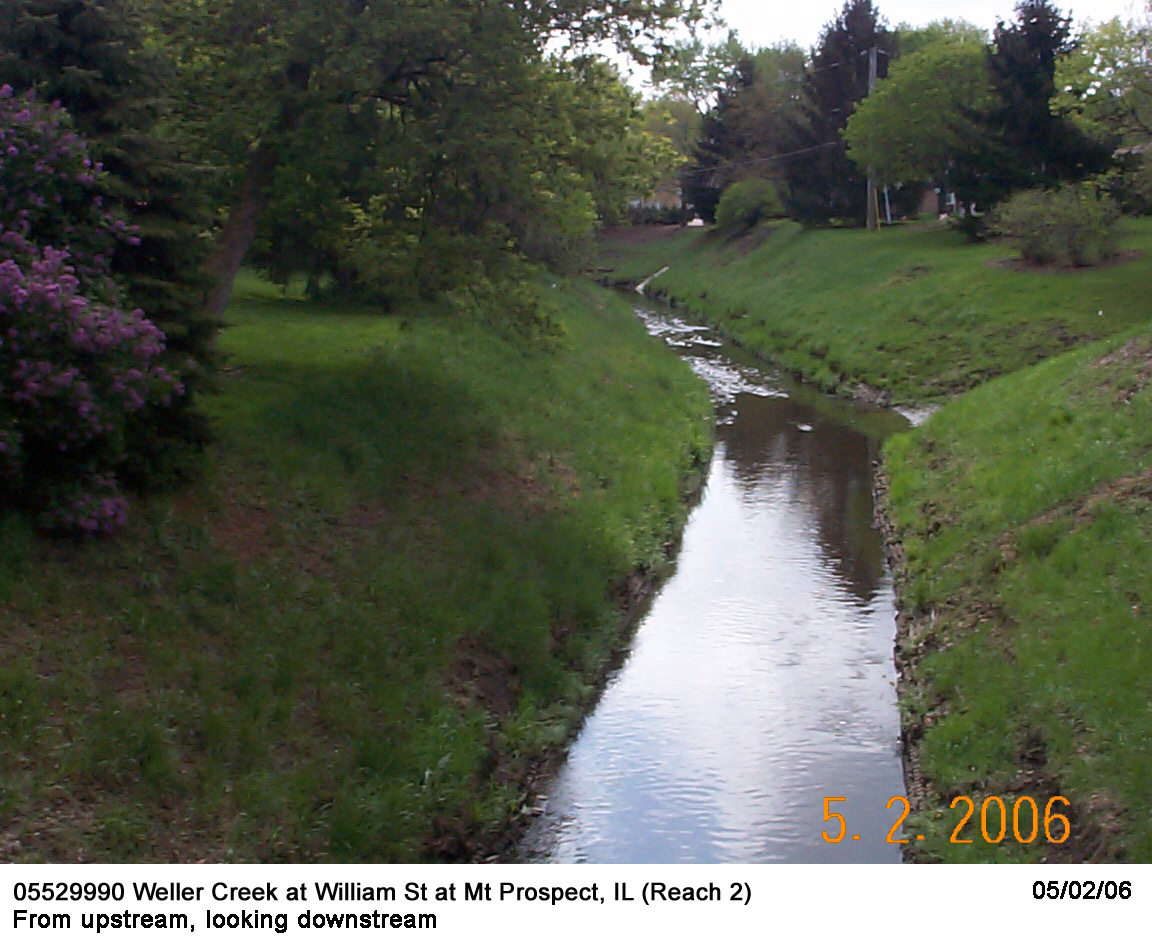
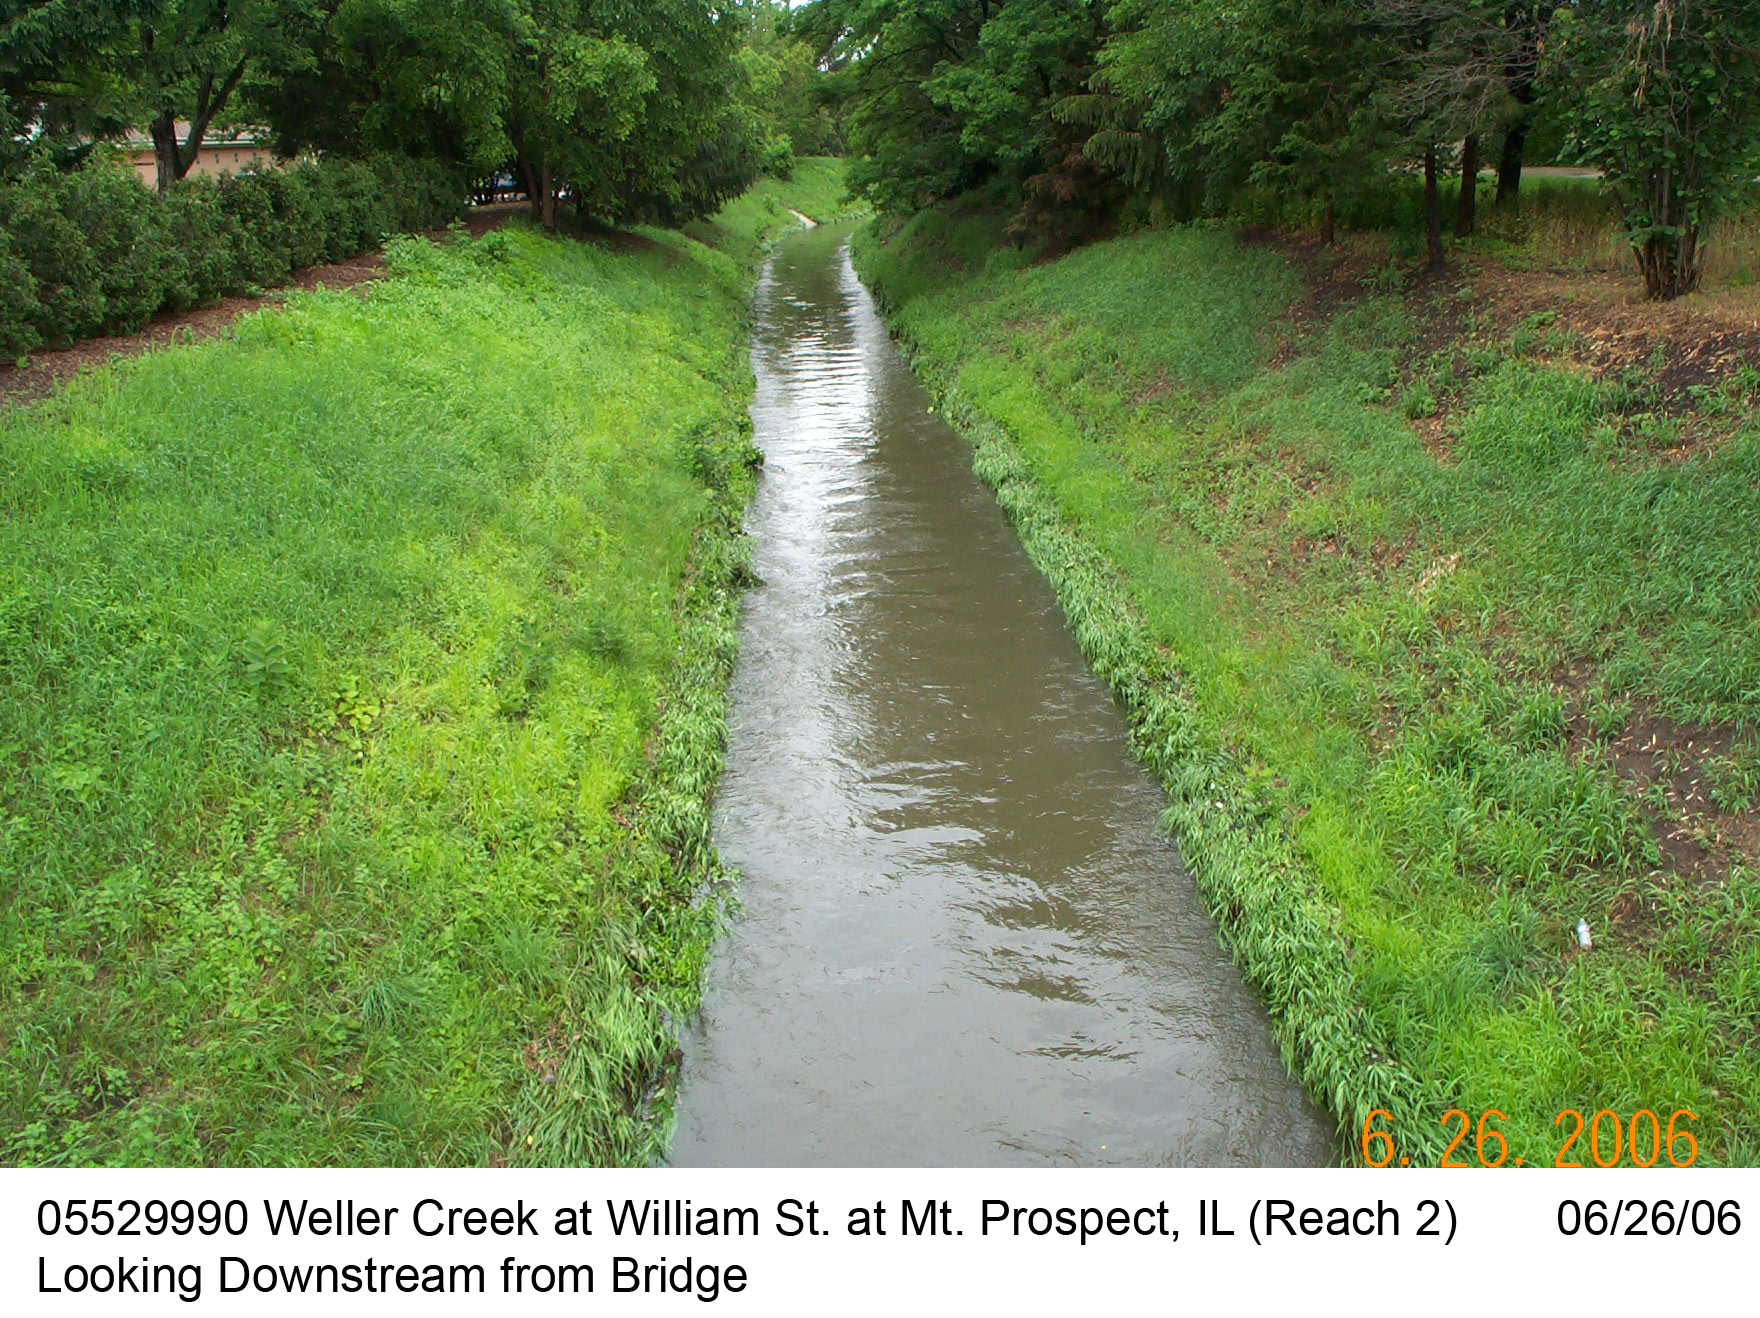
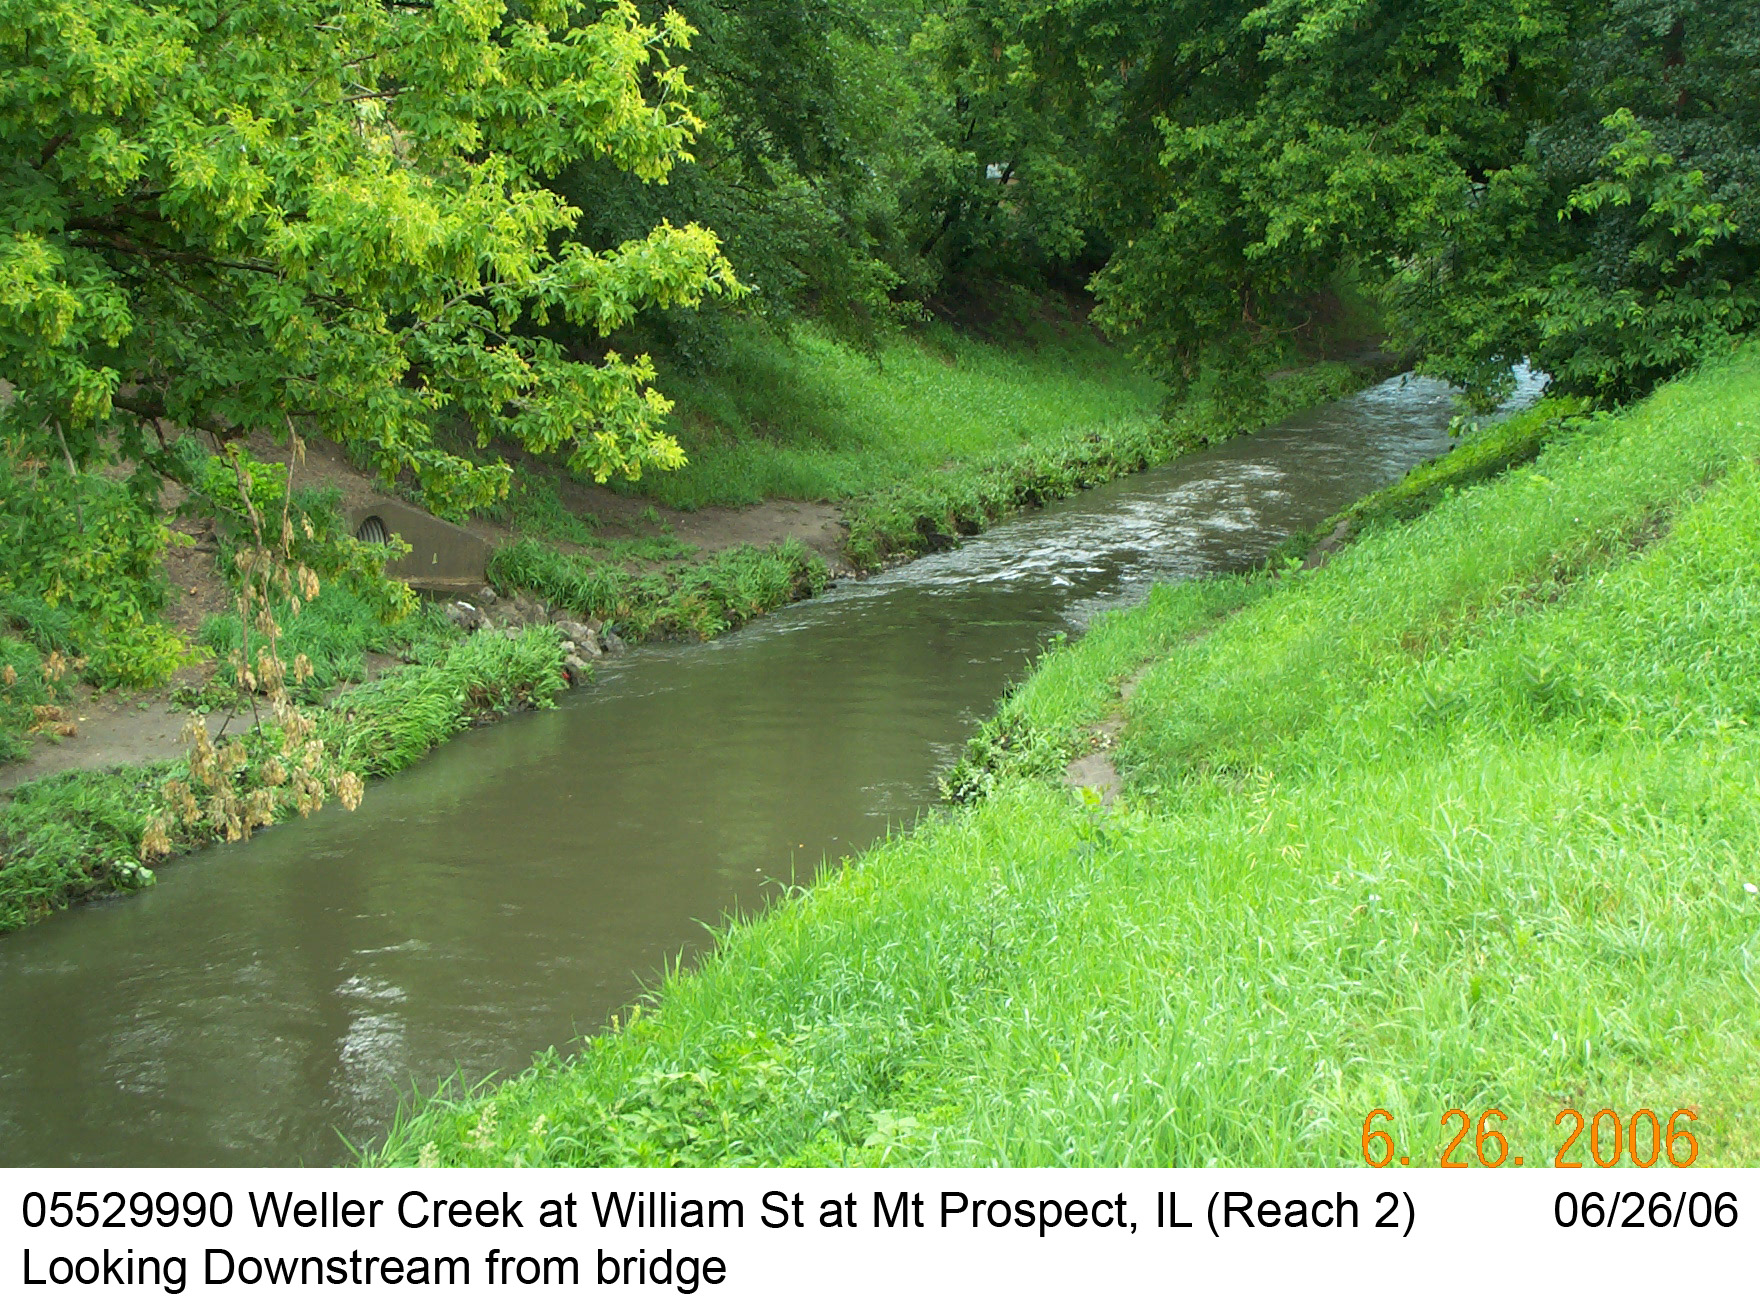
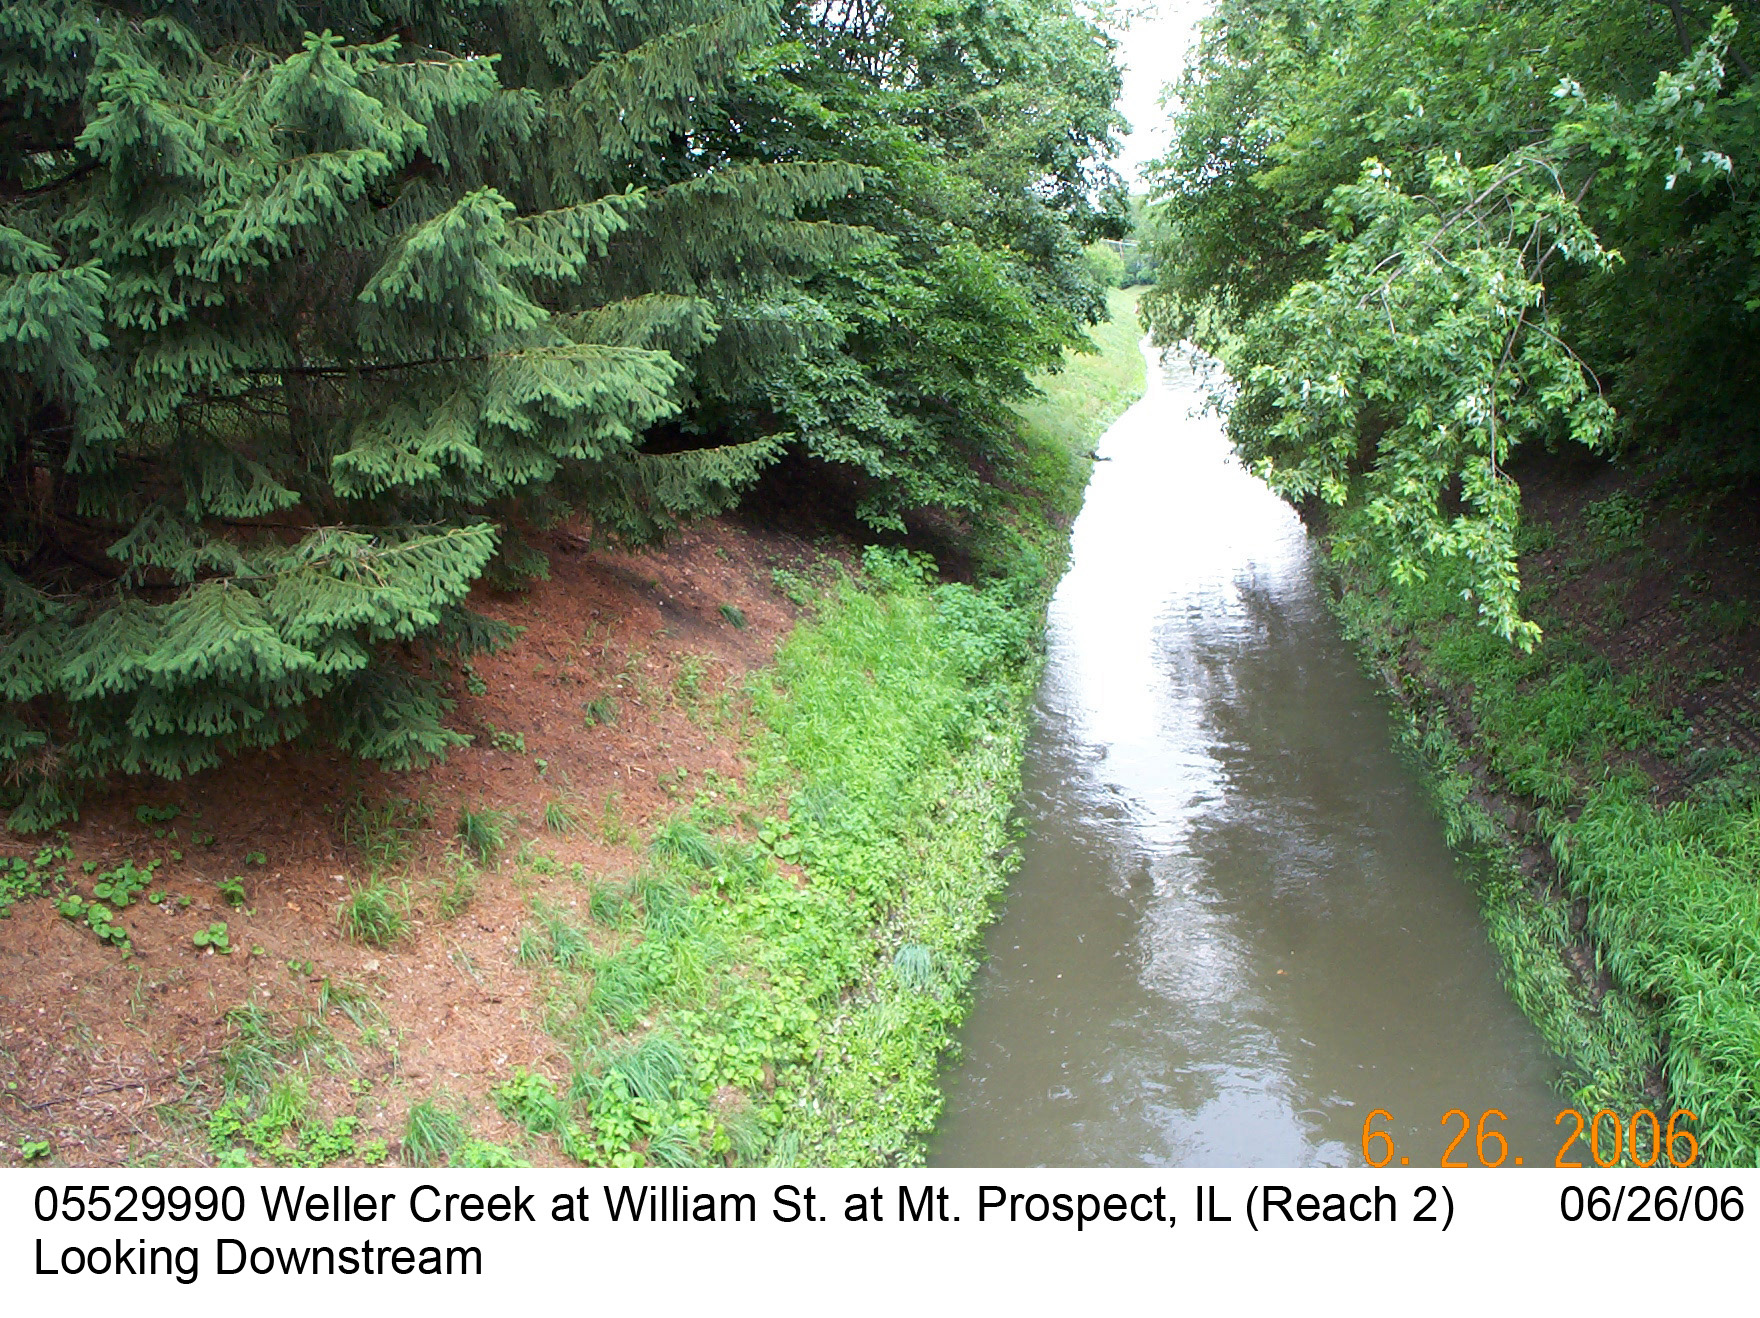
Description of Channel.--This channel has been modified. The streambed material consists of coarse sand and gravel in 12 inch monoslab pavers. The bank consists of 12 inch monoslab pavers over geoweb fabric with tall grass and weeds anchored in the geoweb. Small brushy willows have begun to take root in scattered clumps along the bank. The cross sections are fairly uniform and nearly trapezoidal. The channel is straight upstream and downstream of a gentle bend to the left, which occurs about 500 feet downstream from the School Street footbridge.
Floods.--Maximum discharge during period of record, 1,590 ft3/s on June 10, 1967, gage height, 15.09 ft.

![]() U.S. Department of the Interior |
U.S. Geological Survey
U.S. Department of the Interior |
U.S. Geological Survey
URL: http://il.water.usgs.gov/proj/nvalues/db/sites/05529990.shtml[an error occurred while processing this directive]?
Page Contact Information: David Soong
Page Last Modified: February 4, 2013
