

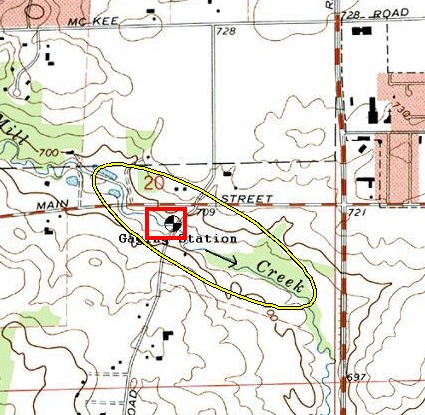
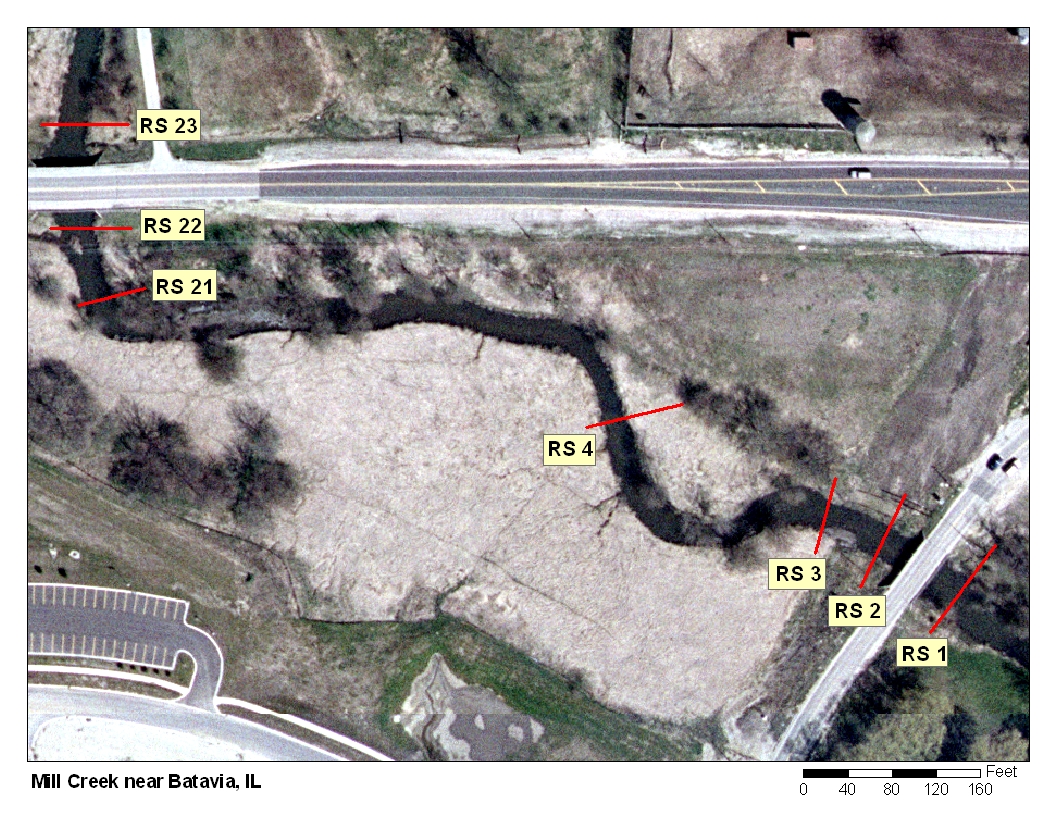
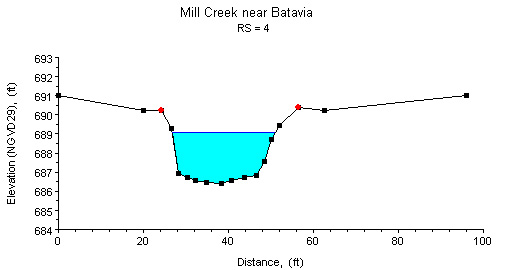
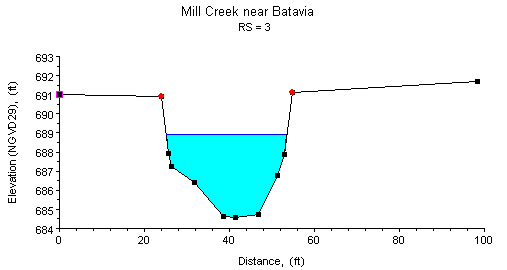
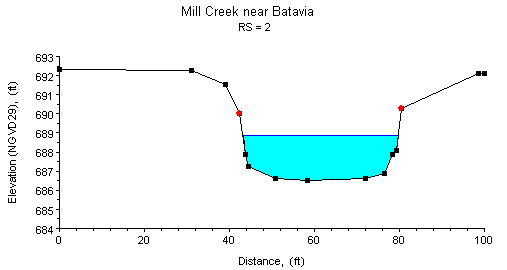
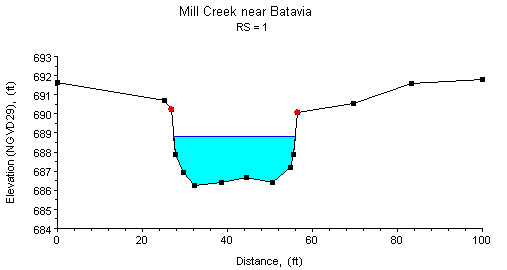
Study Reach.--The channel reach is a meandering, natural river, as shown in the quadrangle map on the top left. Seven surveyed cross sections (surveyed by the Illinois Department of Natural Resources, in May 2003) are available in a reach from the Main Street bridge (upstream) to the Deer Path Road bridge (downstream). The study reach, approximately 400 ft long, was selected as the lower portion of this segment that starts from river station(RS) RS1 upstream and passing through RS4, where bank vegetation is considered to be consistent in the lower reach. Bank conditions in the vicinity of Main Street were modified during the n-values study. The variations in channel alignment, width and bank conditions, as well as the locations of surveyed cross sections can be viewed in the aerial photograph on the top right. Cross-sectional geometries, as described by the four downstream surveyed cross sections, are shown in the cross-sectional plots above.
Gage Location.--Lat 41°50’45”, long 88°20’57”, in NW1/4 NW1/4 SE1/4 sec.20, T.39N., R.8E., Kane County, Hydrologic Unit 07120007, on the left bank at the bridge on Deer Path road, 1.0 mi west of Batavia, and at river mi2.9. The USGS streamgage station number is 05551330.
Drainage Area.--27.6 sq mi.
Gage Datum and Elevations of Reference Points.--Datum of the gage is 685.00 ft. A wire-weight gage (WWG) is attached to the upstream side of the Deer Path Road bridge. A reference point for the n-values study (RP-N1) is two file marks on the 2nd I-beam from the left on the downstream side of the Main Street bridge upstream from the gage, elevation = 698.794 ft. All elevations are referenced to NGVD29.
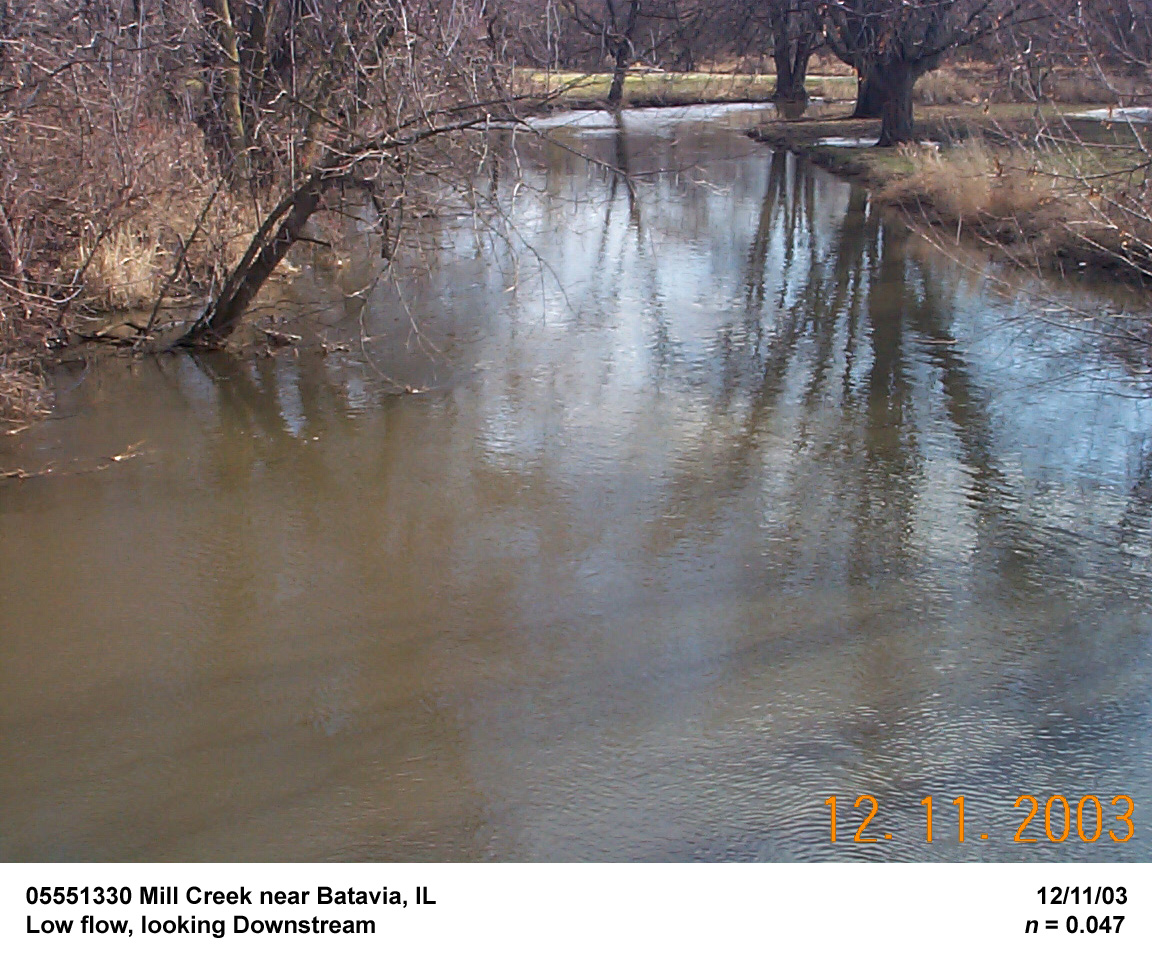
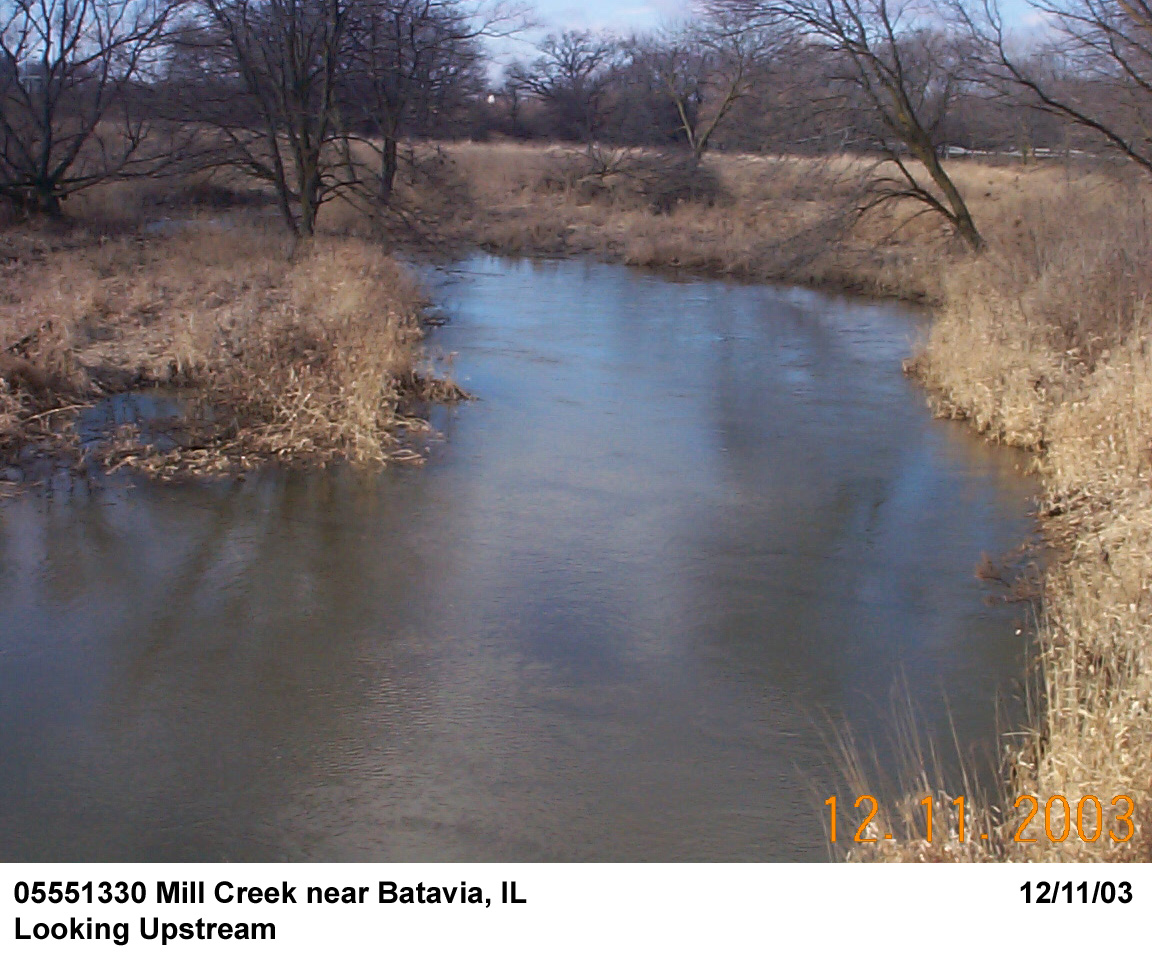
Stage, Discharge Measurements, and Computed n-Values.--Water-surface elevations are measured from the WWG and from RP-N1 before and after each discharge measurement. Water-surface slope for the study reach is determined to be equal to that between the Main Street bridge and the Deep Path Road bridge. Discharge measurements are made using the conventional current-meter method. The computed n-values are listed in the following table. Whenever possible, the computed n-values are associated with a photograph taken at the time of the measurement. The photographs are arranged from low to high discharge in order to illustrate the contributing factors of n-values at a particular discharge.
| Date of Observation | Discharge (ft3/s) | Average Cross Section Area (ft2) | Hydraulic Radius (ft) | Mean Velocity (ft/s) | Slope (ft/ft) | Coefficient of Roughness n |
|---|---|---|---|---|---|---|
| 5/26/2004 | 30.1 | 51.1 | 1.72 | 0.63 | 0.000412 | 0.074 |
| 3/11/2002 | 63.8 | 68.7 | 2.20 | 0.97 | 0.000608 | 0.064 |
| 12/11/2003 | 102.0 | 92.4 | 2.74 | 1.14 | 0.000473 | 0.047 |
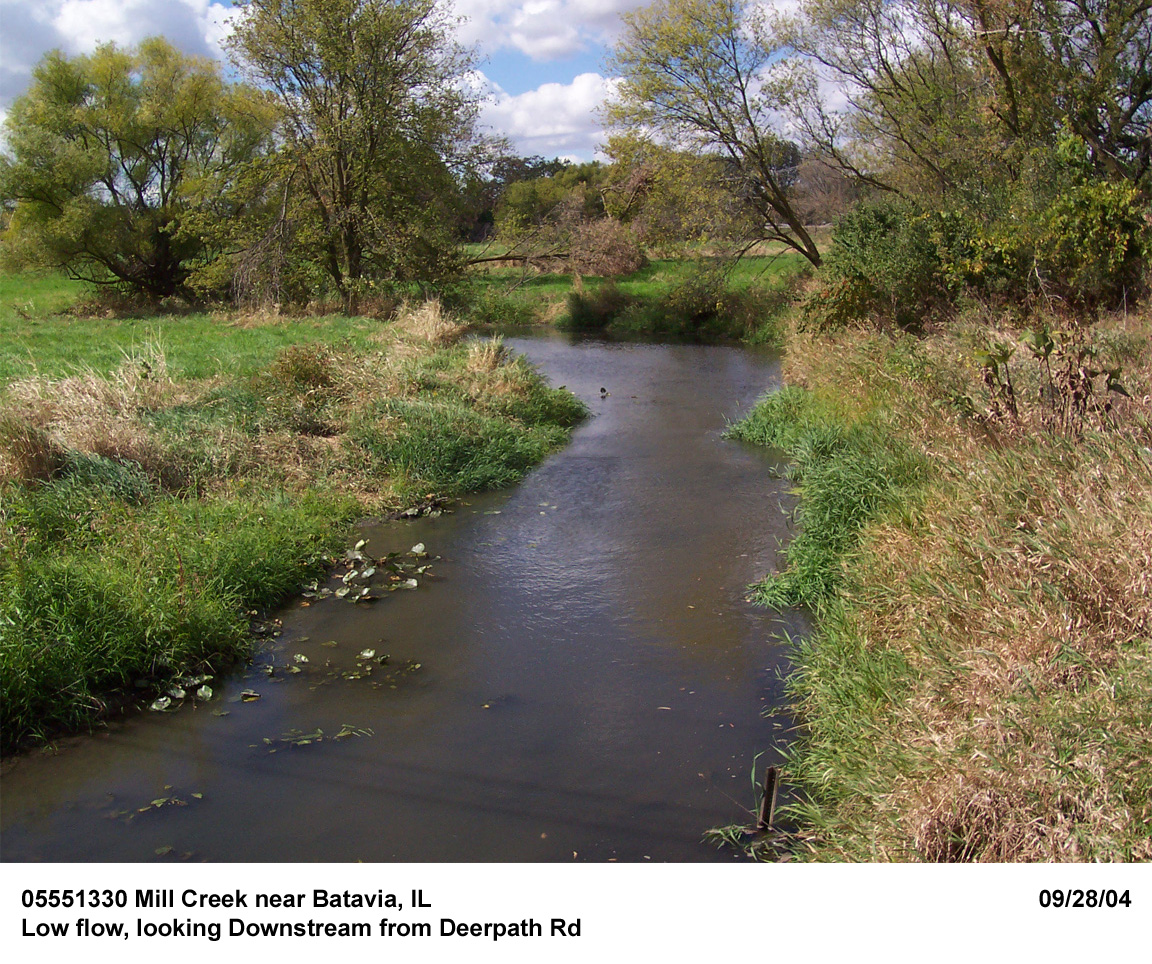
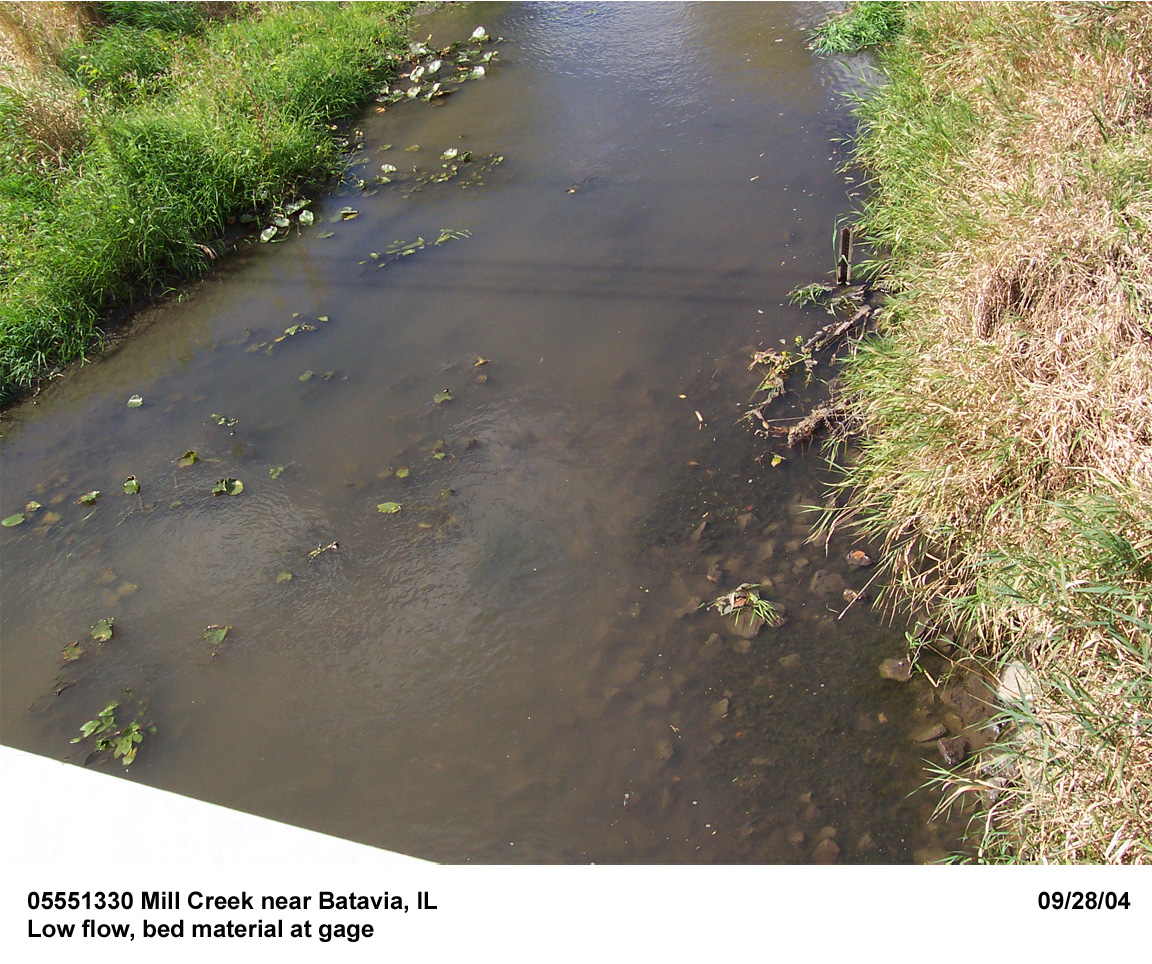
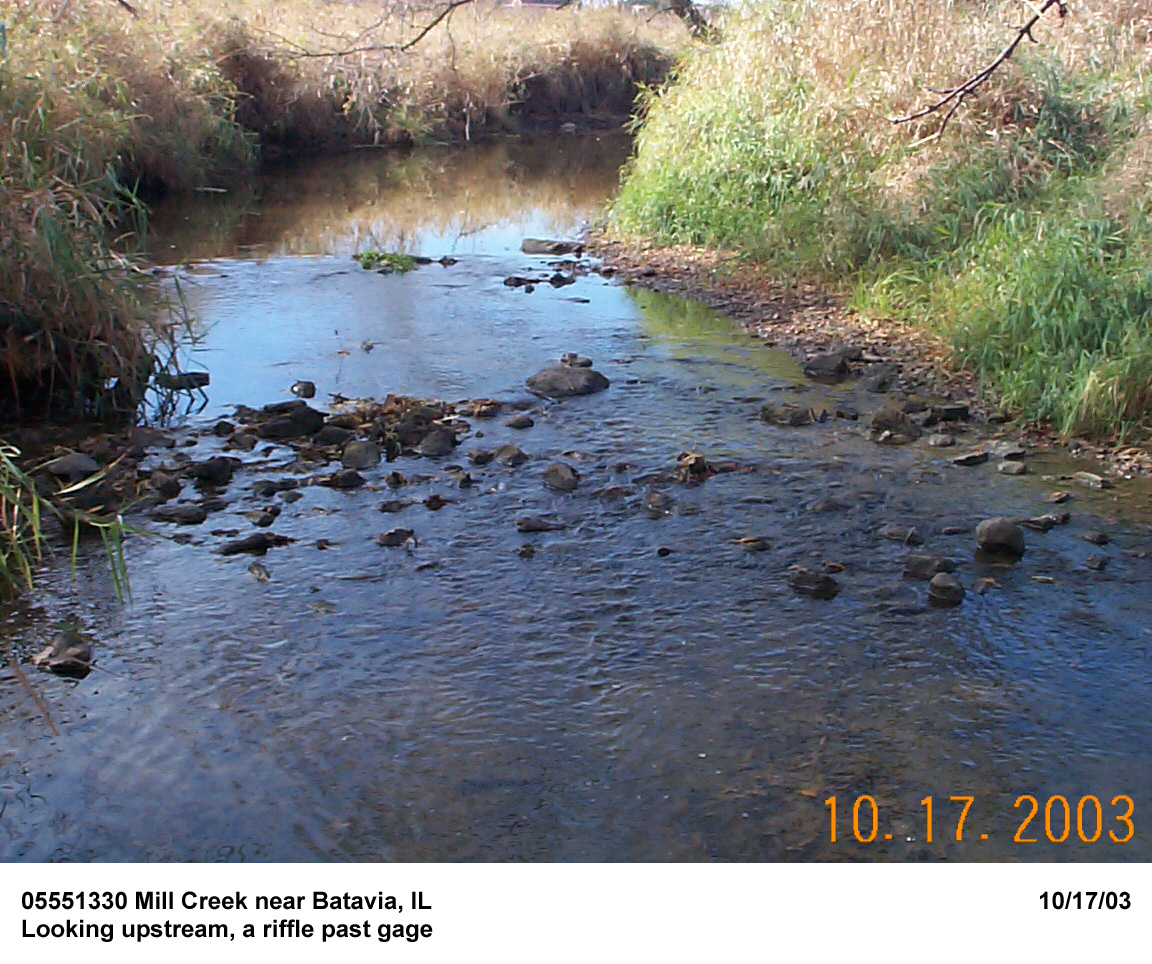
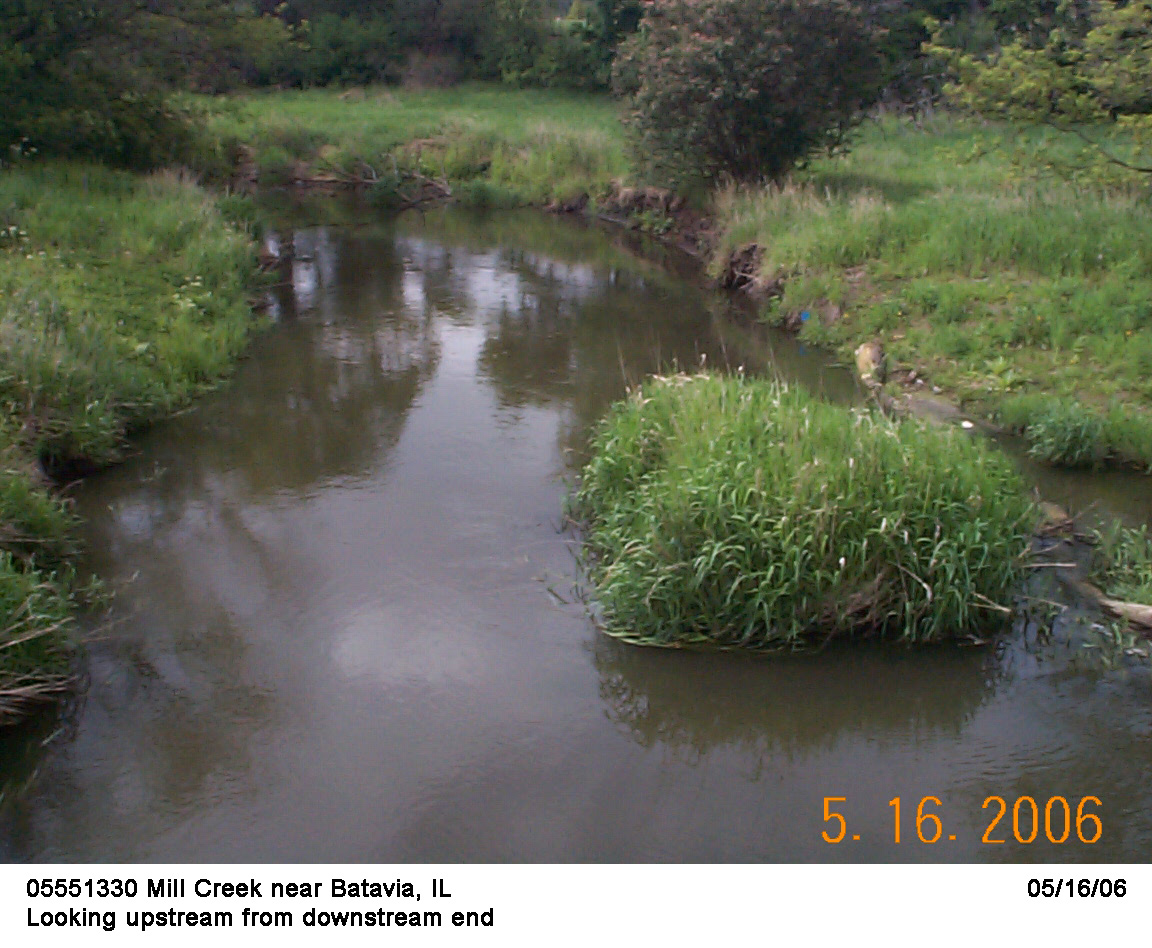
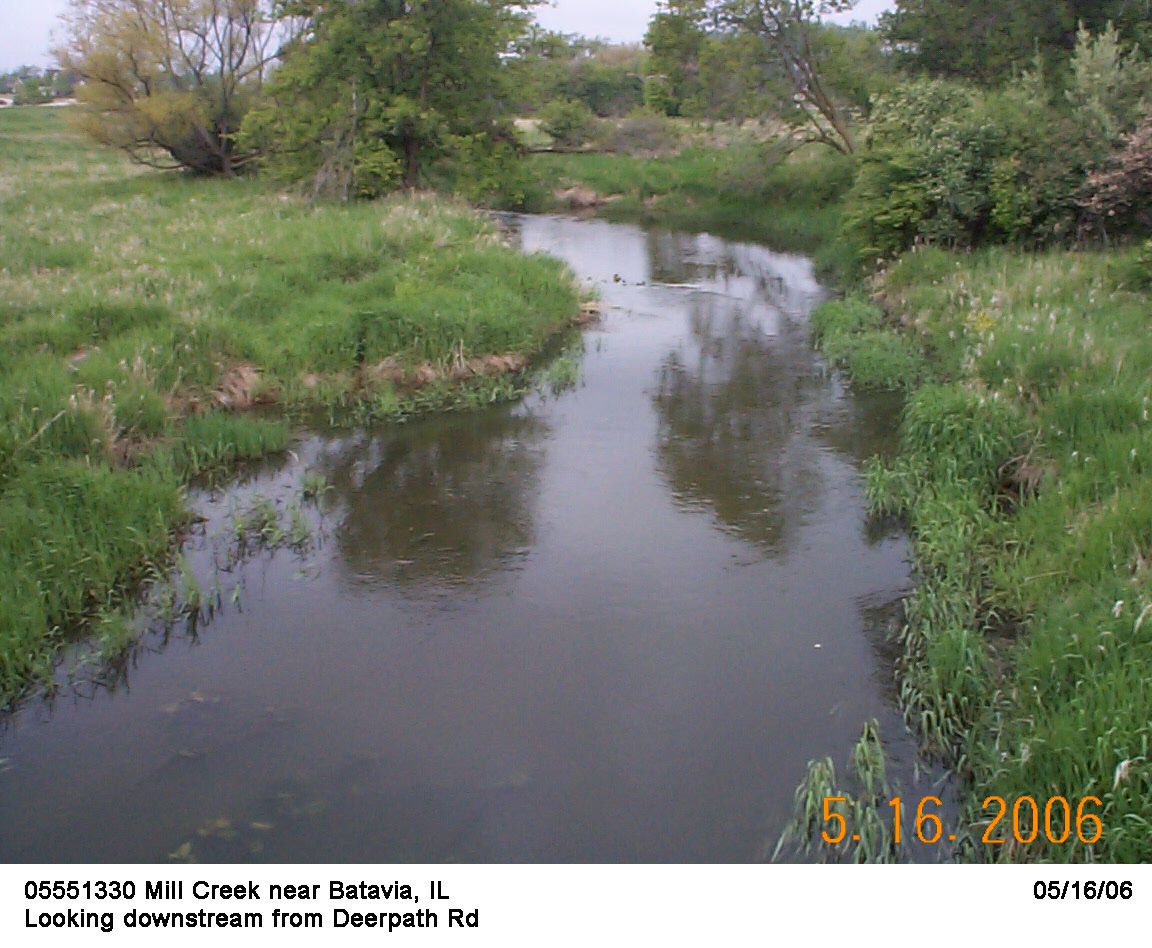
Description of Channel.--This channel is natural. The streambed is composed of shifting sand and silt with scattered gravel and cobble riffles in the reach upstream of the Deer Path Road bridge. Bank materials are mostly clay-sand mixes Tall, flexible weeds (~2-4 ft) grow at the water’s edge and in open areas on the flood plains. Clusters of young trees are moderately distributed at the water’s edge and on the flood plain. Channel geometry is generally trapezoidal in shape with an average bottom width approximately 25 ft; bank heights are from 4 to 6 ft. Top width is approximately 30 ft. Note that the channel downstream from the Main Street bridge is subject to beaver dams and woody debris jams. The study reach includes a complete cycle of meandering bends.
Floods.-- Maximum discharge, 4,510 ft3/s, September 13, 2008, gage height, 9.48 ft.

![]() U.S. Department of the Interior |
U.S. Geological Survey
U.S. Department of the Interior |
U.S. Geological Survey
URL: http://il.water.usgs.gov/proj/nvalues/db/sites/05551330.shtml[an error occurred while processing this directive]?
Page Contact Information: David Soong
Page Last Modified: February 4, 2013
