

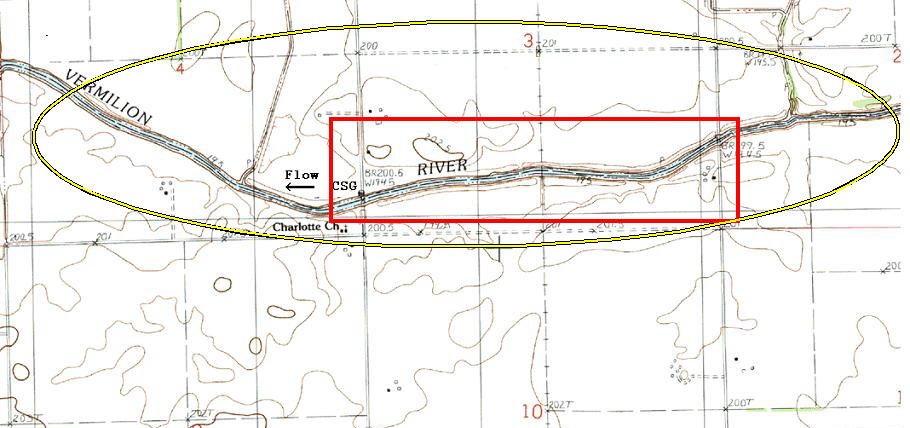
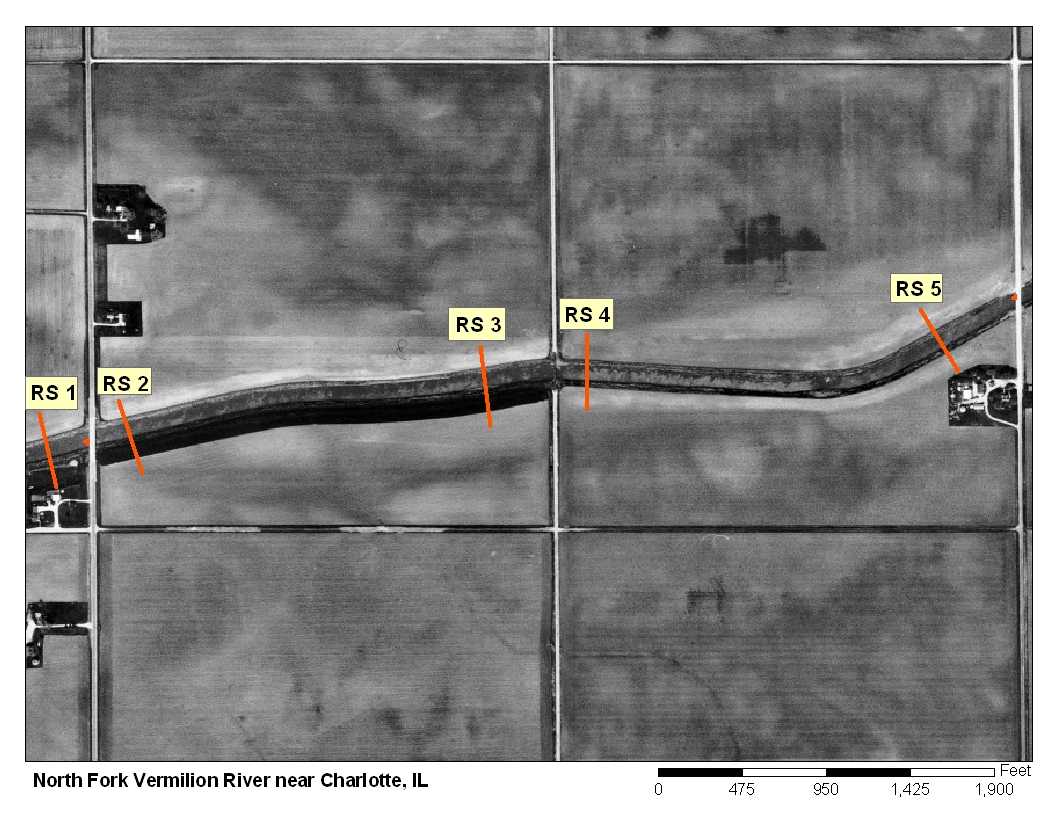
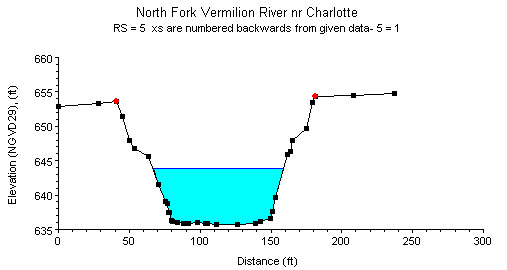
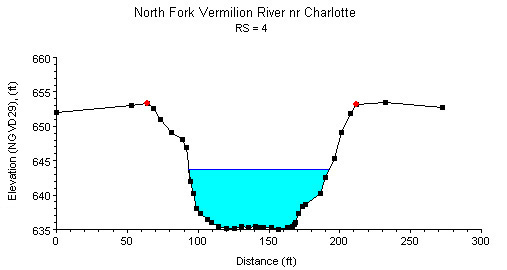
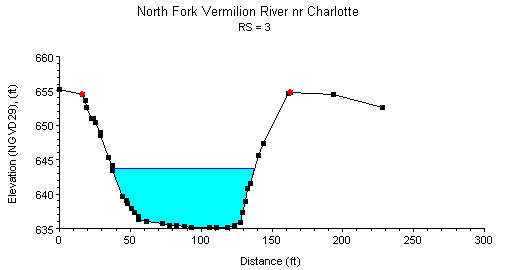
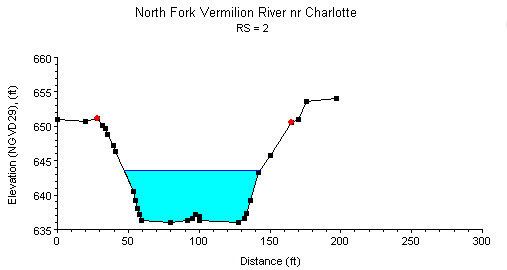
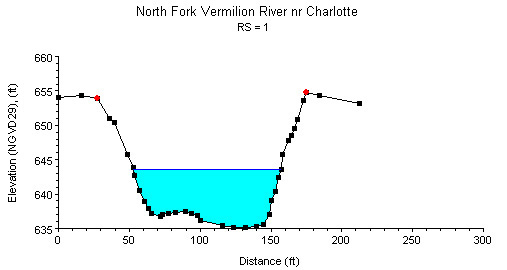
Study Reach.--The channel reach is a dredged channel in agricultural fields with grass cover on both banks. The study reach, 5,324 ft long, is located from 200 ft downstream of the County Road 3400E bridge to 200 ft downstream of the County Road 3300E bridge, as shown in quadrangle map on the top left. There are five surveyed cross sections (surveyed by the U.S. Geological Survey in January 2003) available for evaluating the characteristics of channel geometry in the study reach. The alignment of the channel, approximate variations in channel width and bank conditions, and locations of surveyed cross sections are shown in the aerial photograph on the top right. General shapes of the cross sections in the study reach are plotted above.
Gage Location.--Lat 40°50'08", long 88°17'56", in the SE1/4 SE1/4 sec.4, T.27N., R.8E. Livingston Co., Hydrologic Unit 07130002, at the bridge on County Highway 3, 1.2 mi northwest of Charlotte, and 5.5 mi north of Chatsworth. The USGS streamgage station number is 05554000.
Drainage Area.--186 sq mi.
Gage Datum and Elevations of Reference Points.--Datum of the gage is 638.00 ft. A reference point, RP-N1, was established for the n-value study. RP-N1 is two file marks on the 9th upright I-beam from the right edge of water on the downstream side of the bridge on County Road 3400E, elevation = 659.975 ft. A reference mark (RM-9) is two file marks on the right downstream corner of the 21st vertical I-beam from the right edge of water on the downstream side of the bridge on county Road 3300E, elevation = 660.432 ft. All elevations are referenced to NGVD29.
Stage, Discharge Measurements, and Computed n-Values.--Water-surface elevations were measured by tape down from RP-N1 and RM-9 before and after each discharge measurement. A corresponding water surface slope was calculated by dividing the difference in water-surface elevation by the reach length between the two points. Discharge measurements were made using the conventional current meter method. The computed n-values are listed in the following table. Whenever possible, the computed n-values are associated with a photograph taken at the time of the measurement. The photographs are arranged from low to high discharge in order to illustrate the contributing factors of n-values at a particular discharge.
| Date of Observation | Discharge (ft3/s) | Average Cross Section Area (ft2) | Hydraulic Radius (ft) | Mean Velocity (ft/s) | Slope (ft/ft) | Coefficient of Roughness n |
|---|---|---|---|---|---|---|
| 4/1/2004 | 603.0 | 386.2 | 4.20 | 1.57 | 0.000064 | 0.020 |
| 5/15/2003 | 1180.0 | 616.2 | 6.08 | 1.92 | 0.000079 | 0.023 |
| 6/1/2004 | 1190.0 | 667.8 | 6.46 | 1.79 | 0.000063 | 0.024 |
| 1/10/2008 | 3010.0 | 1672.2 | 10.79 | 1.80 | 0.000057 | 0.030 |
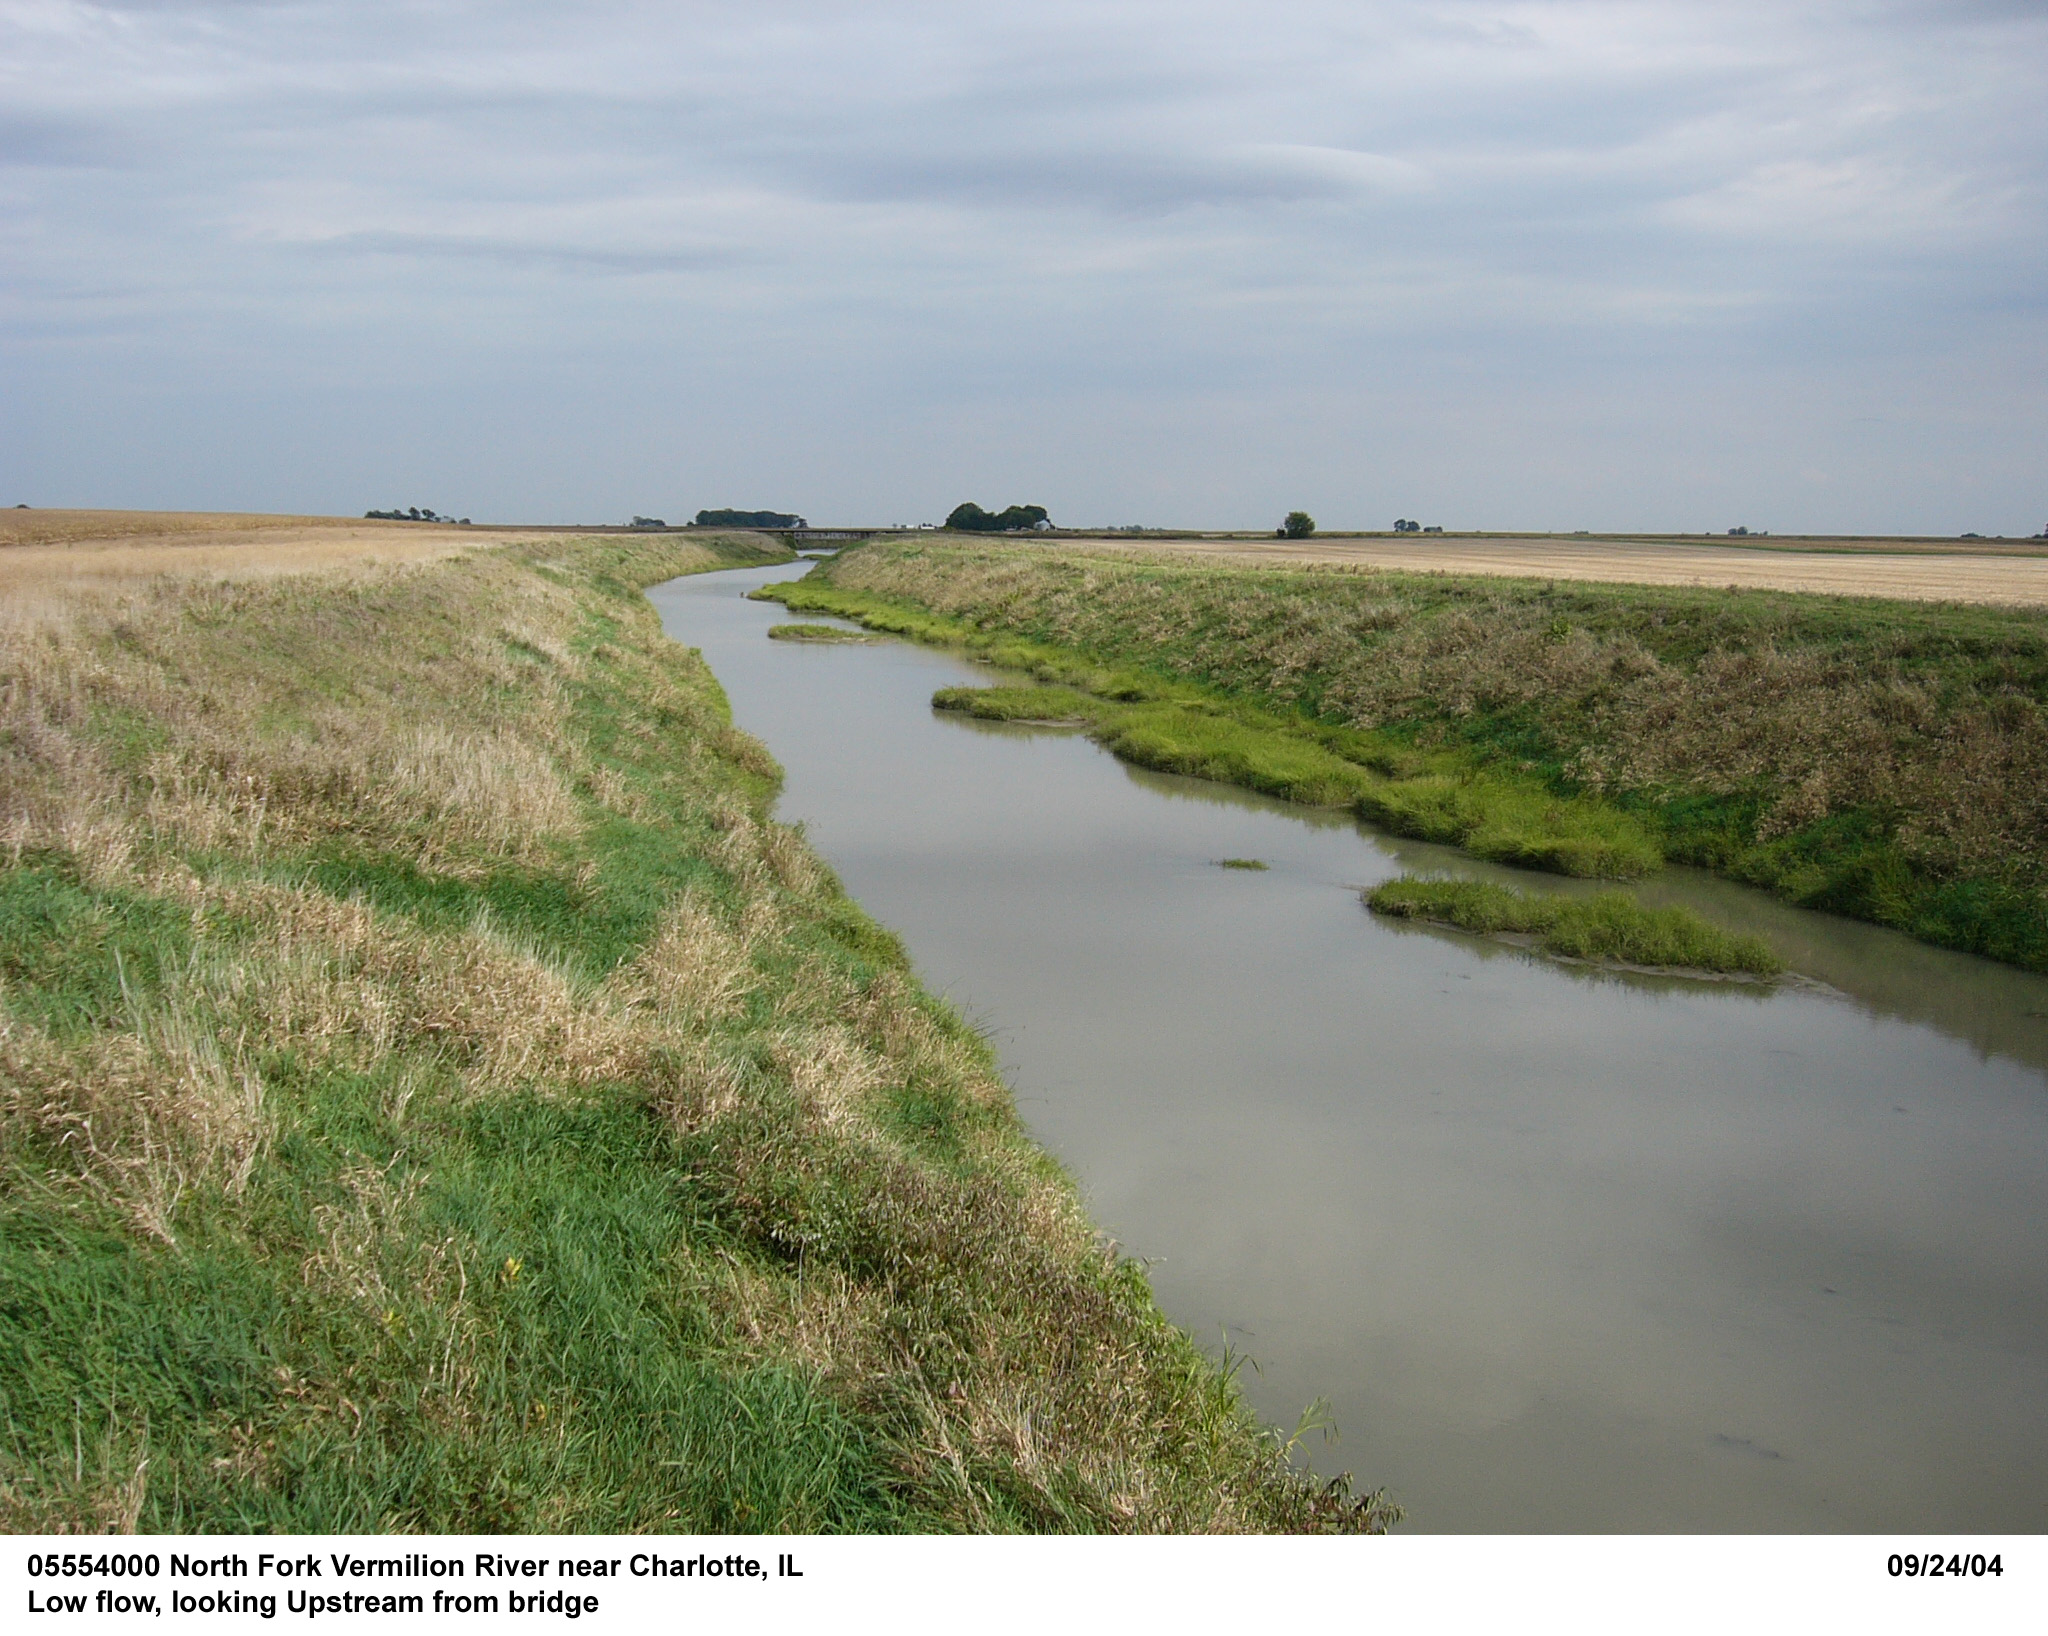
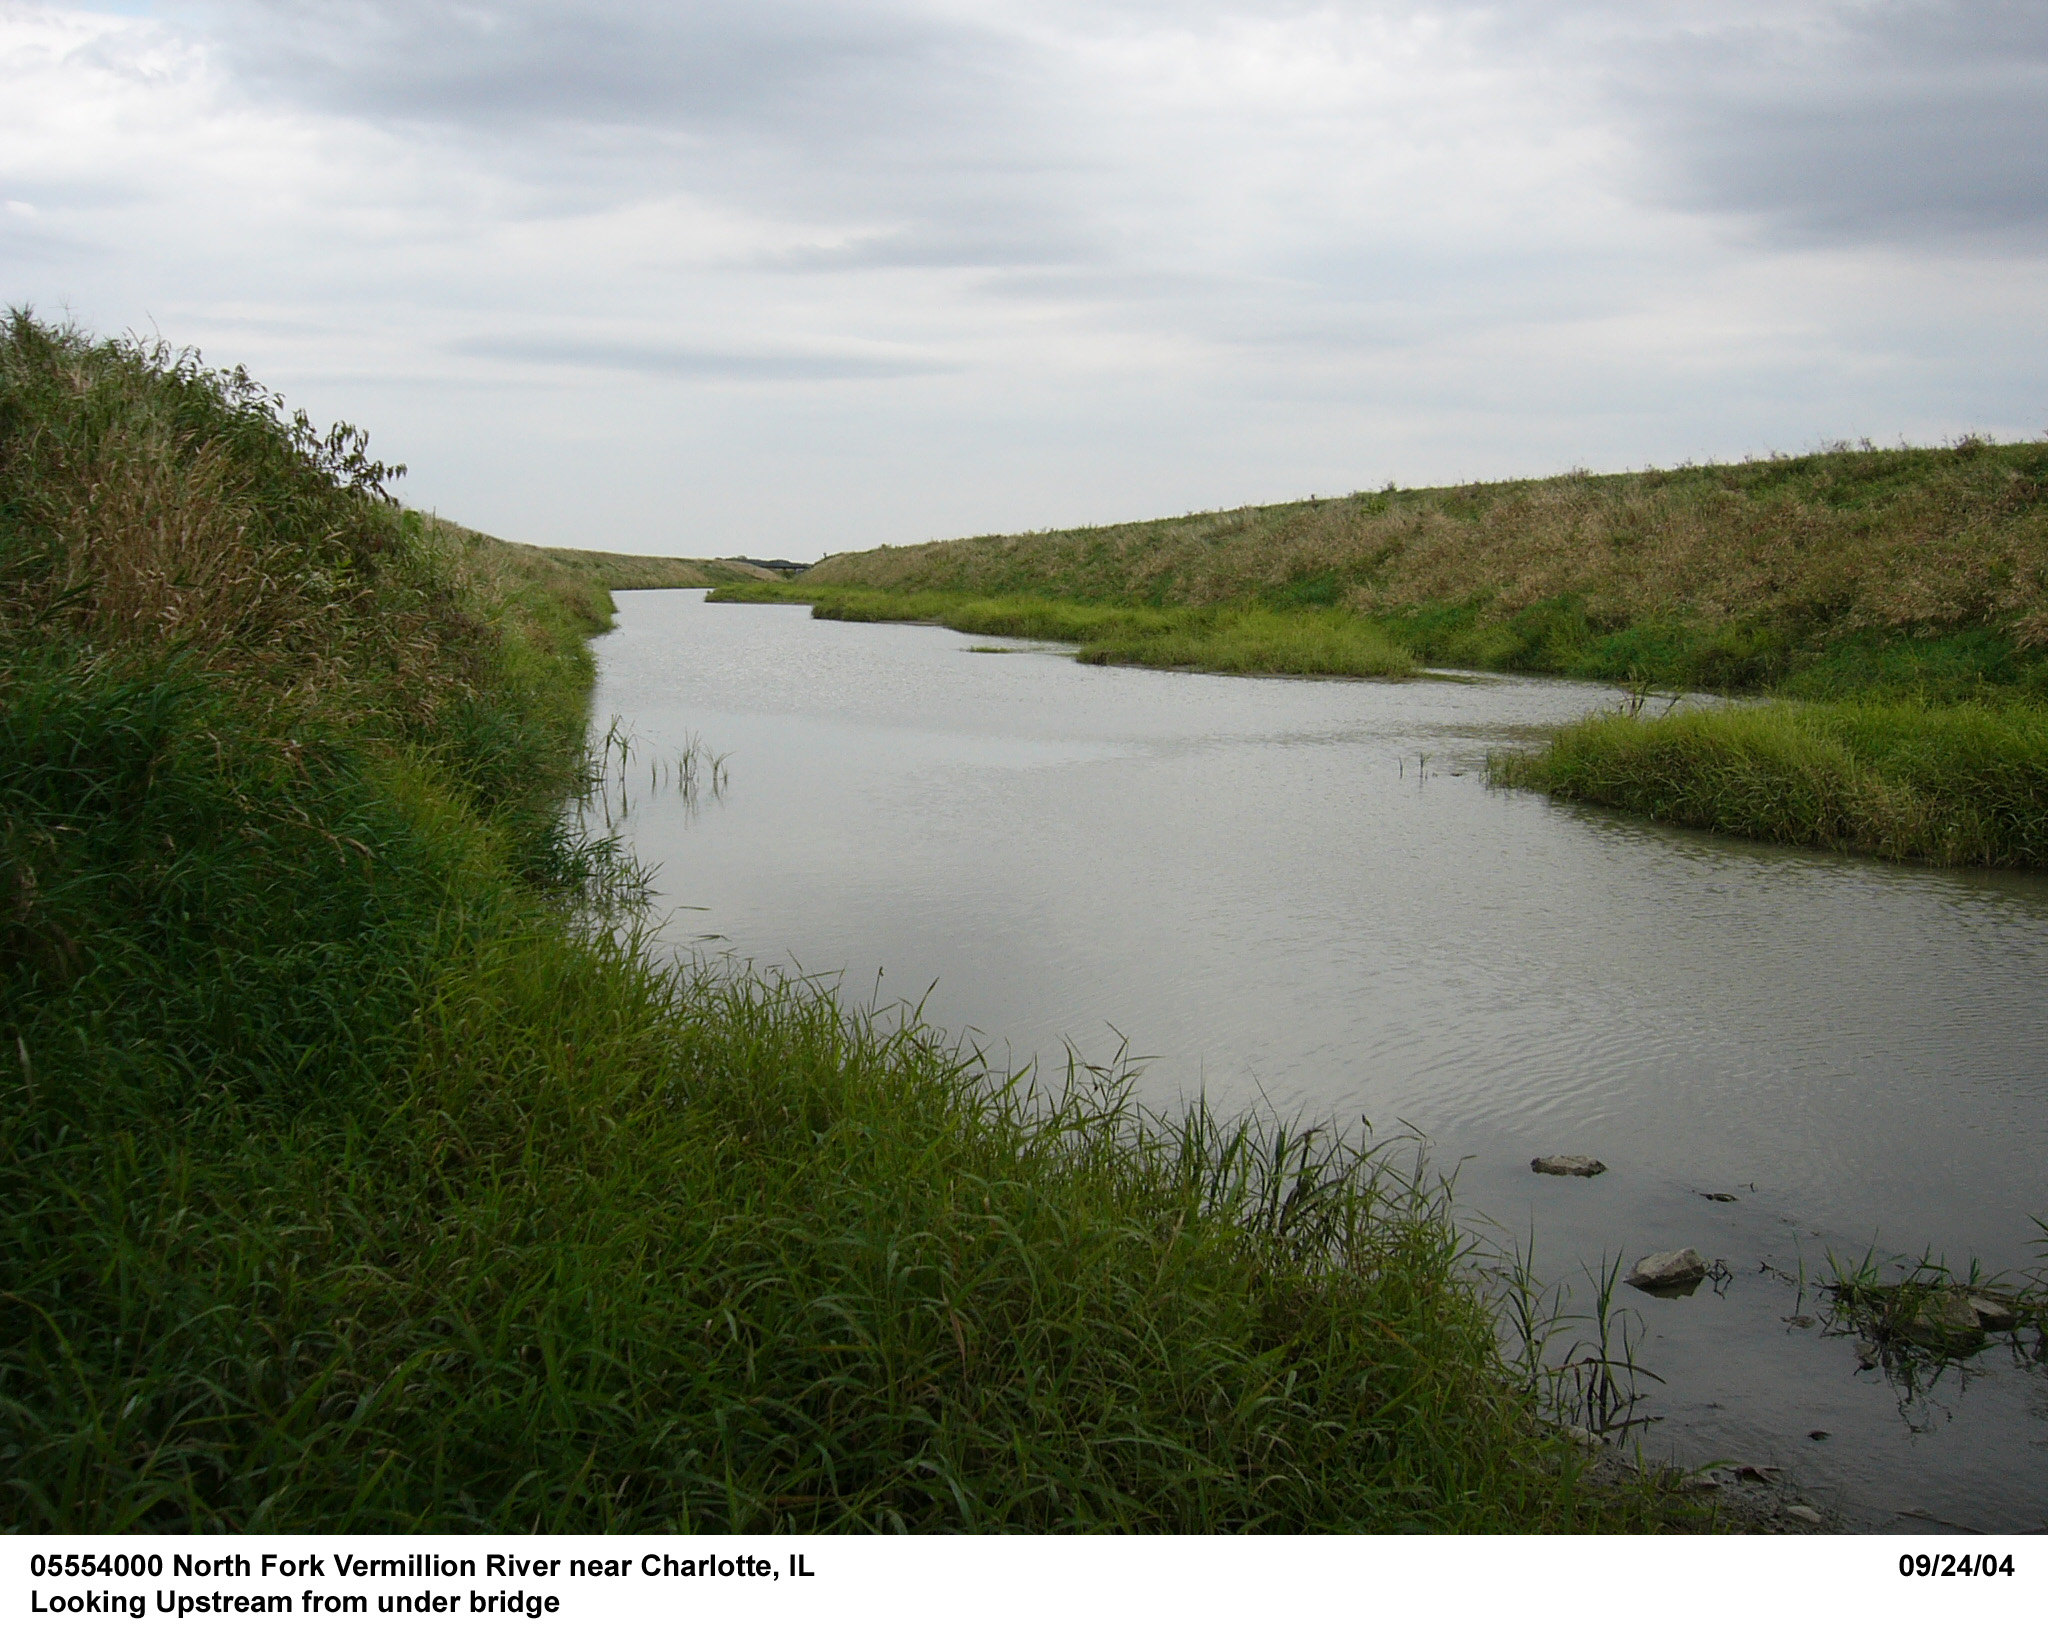
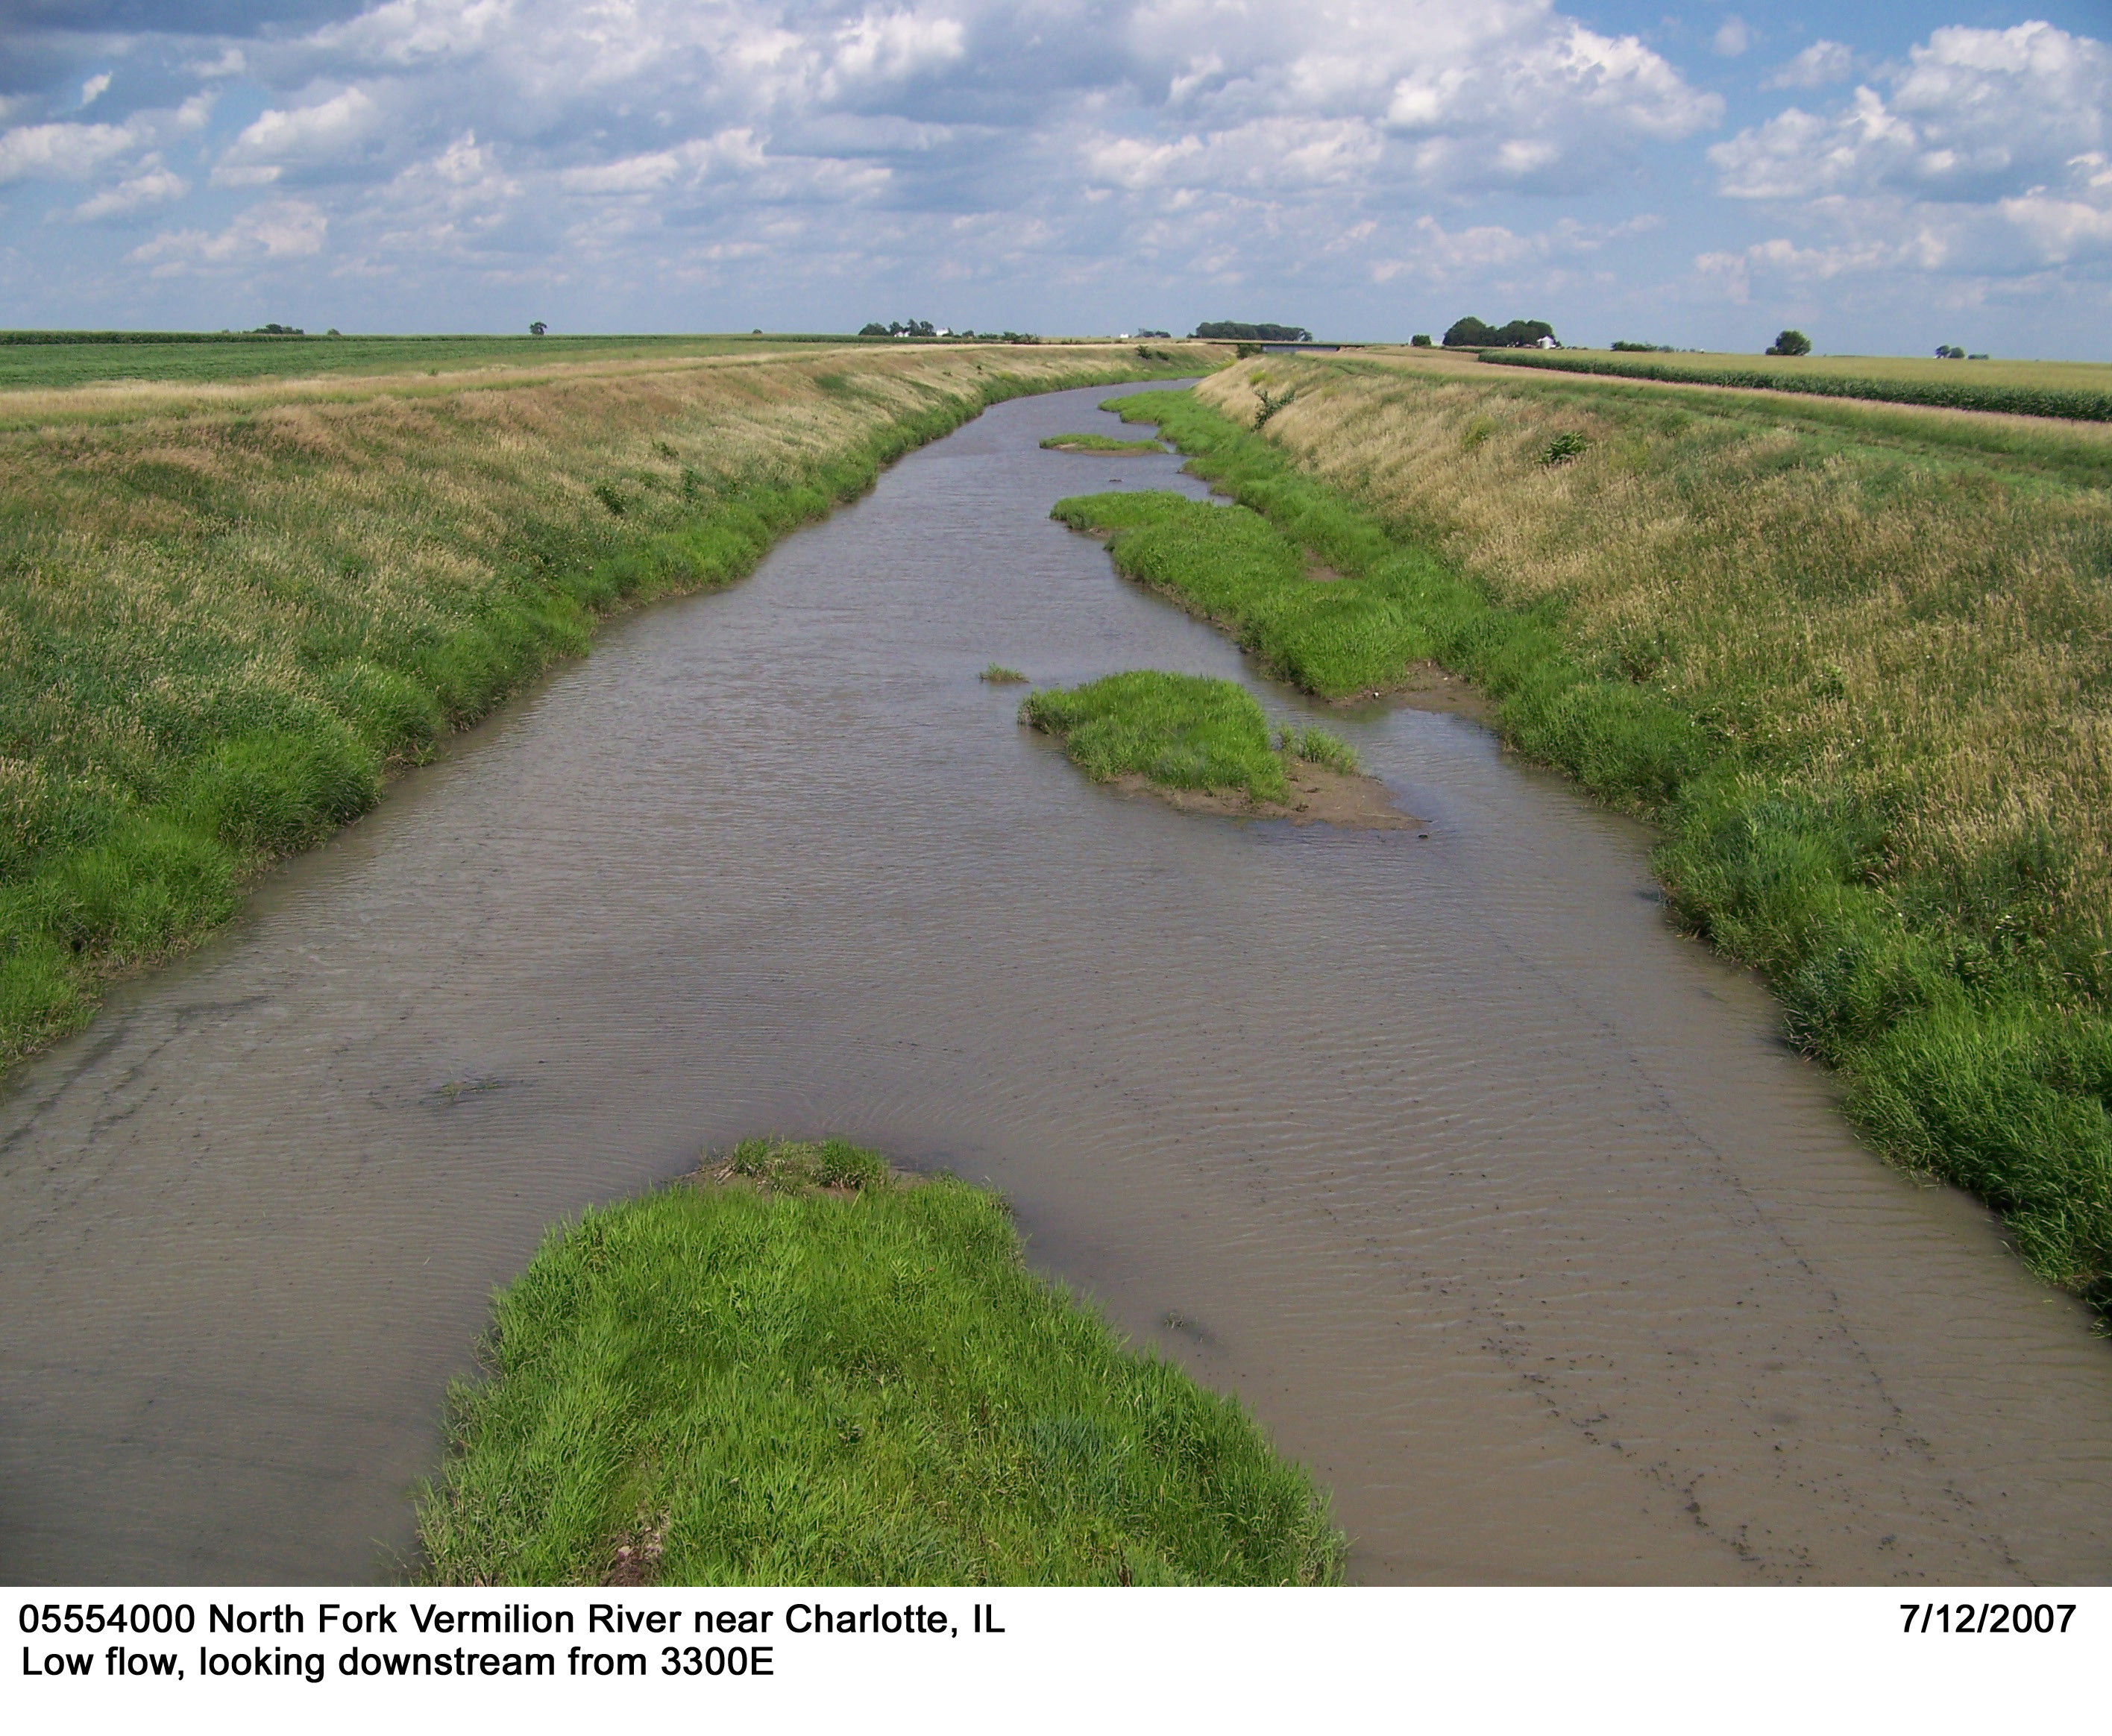
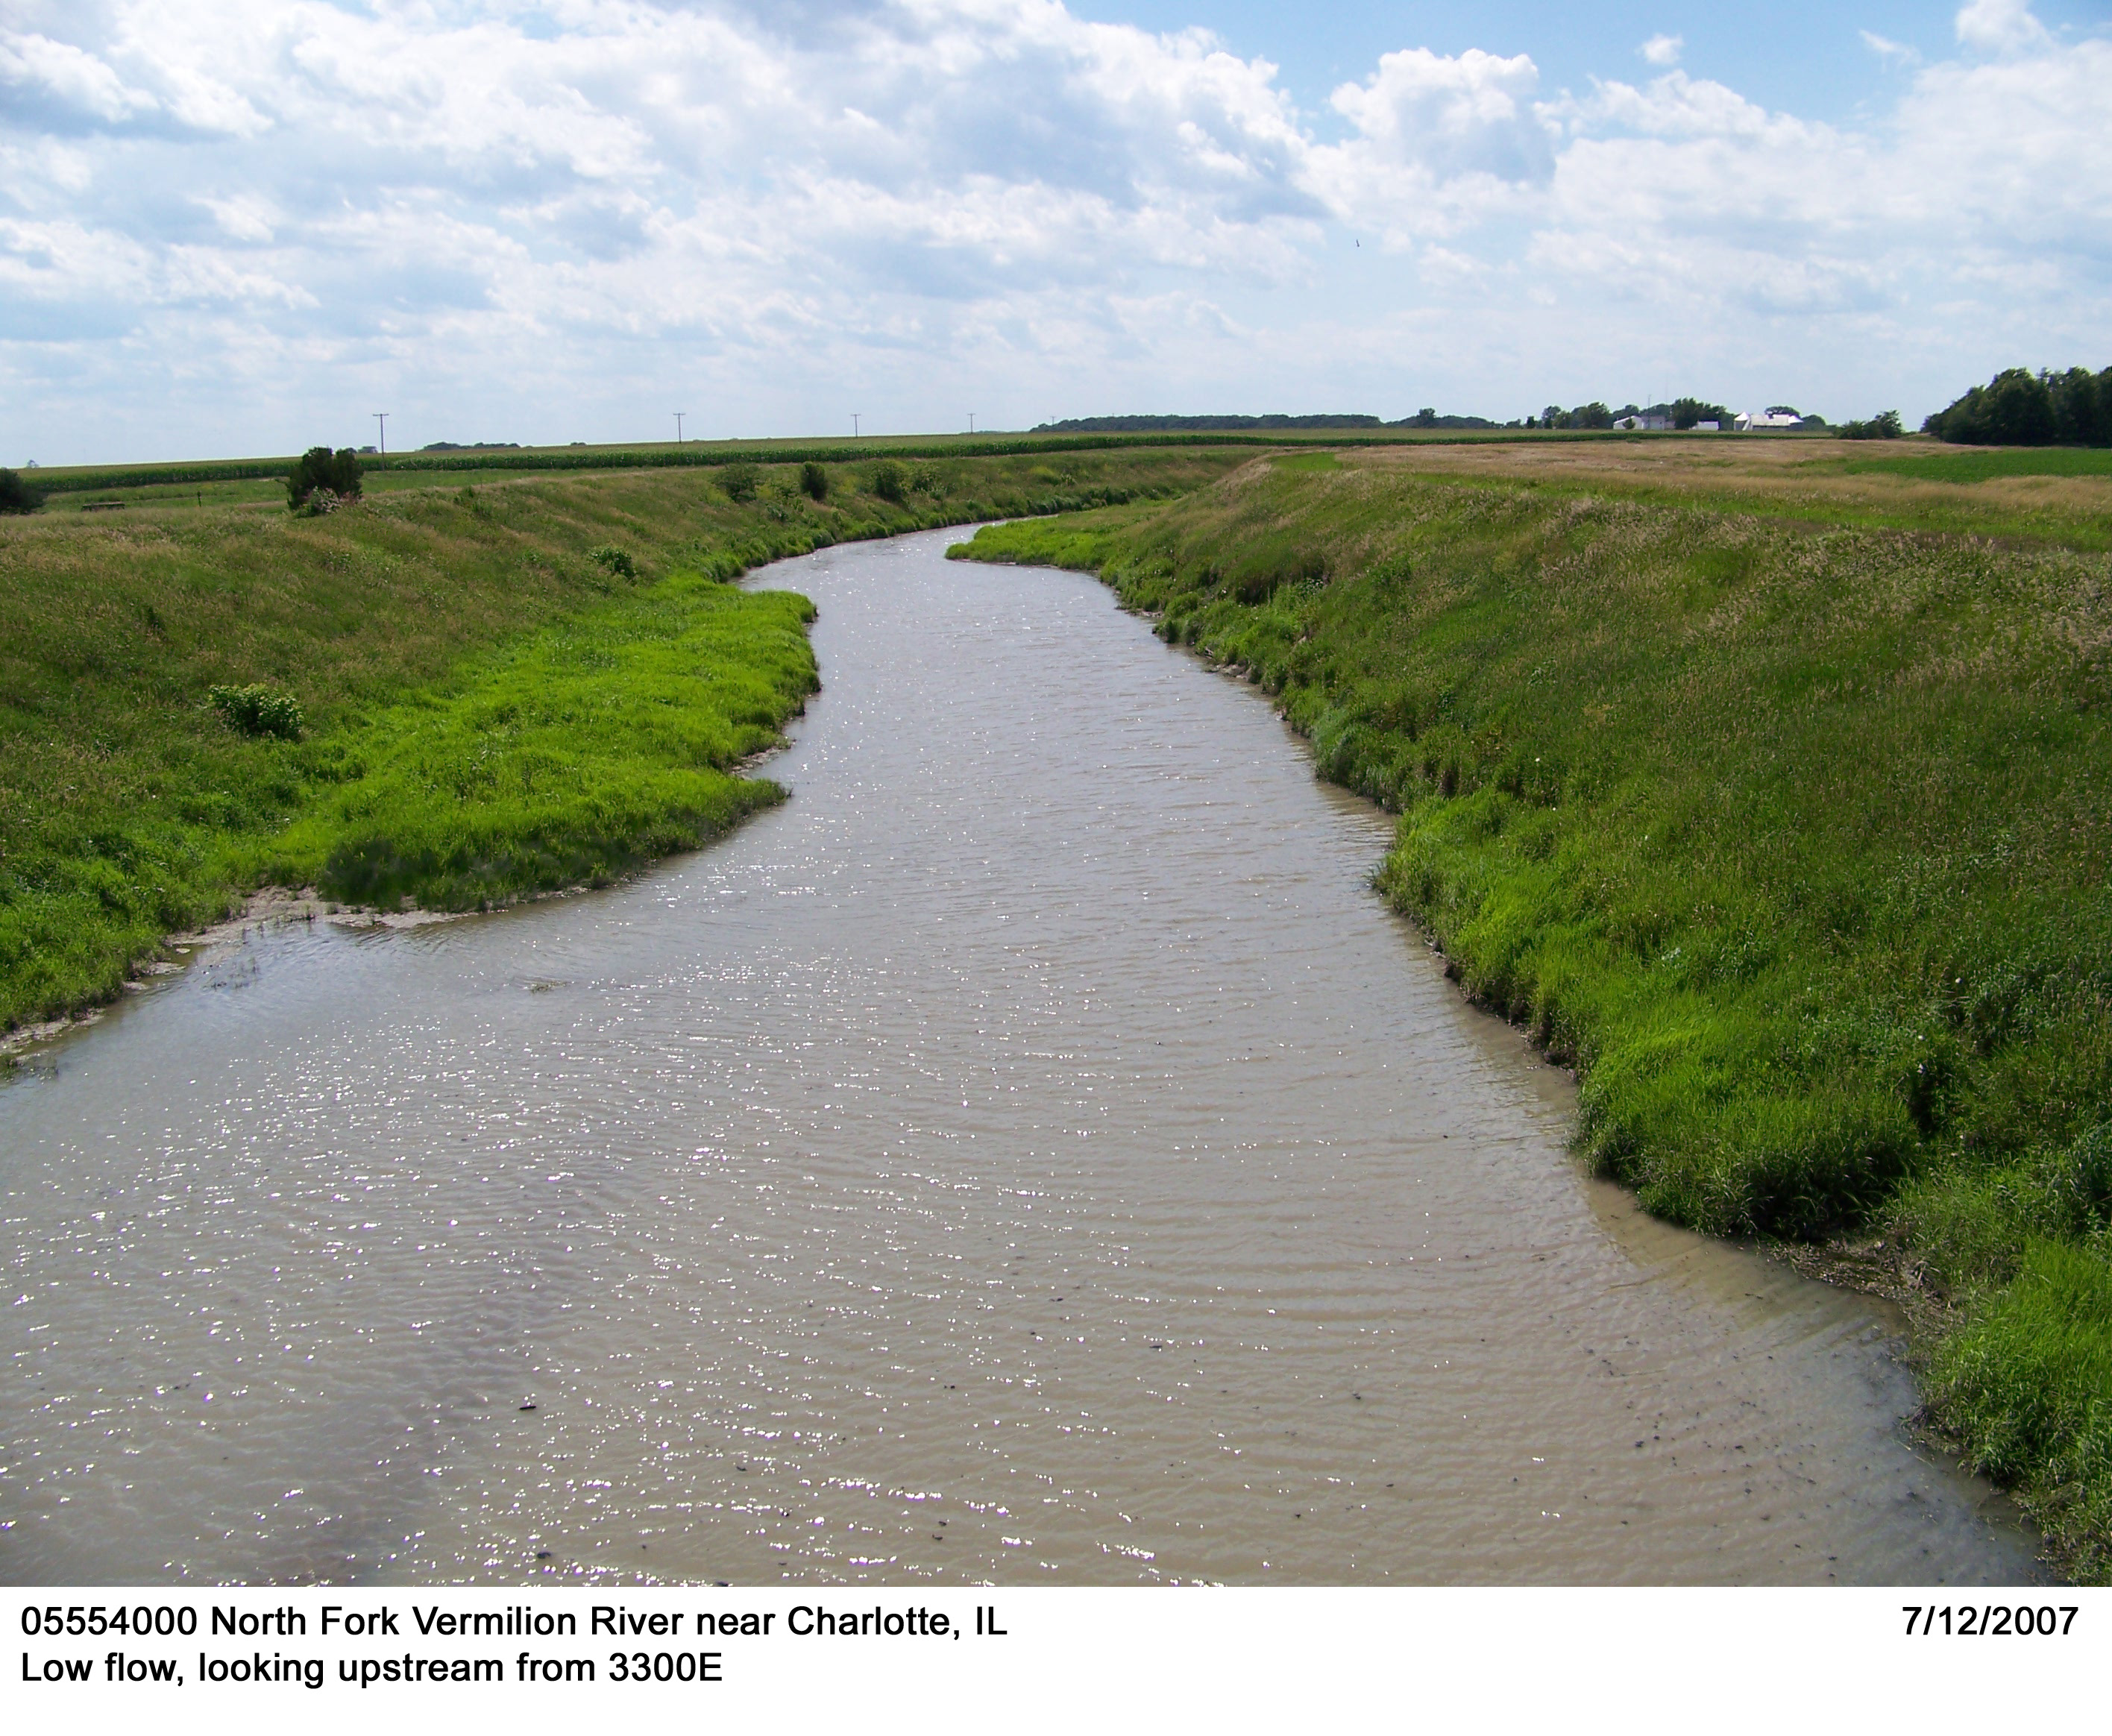
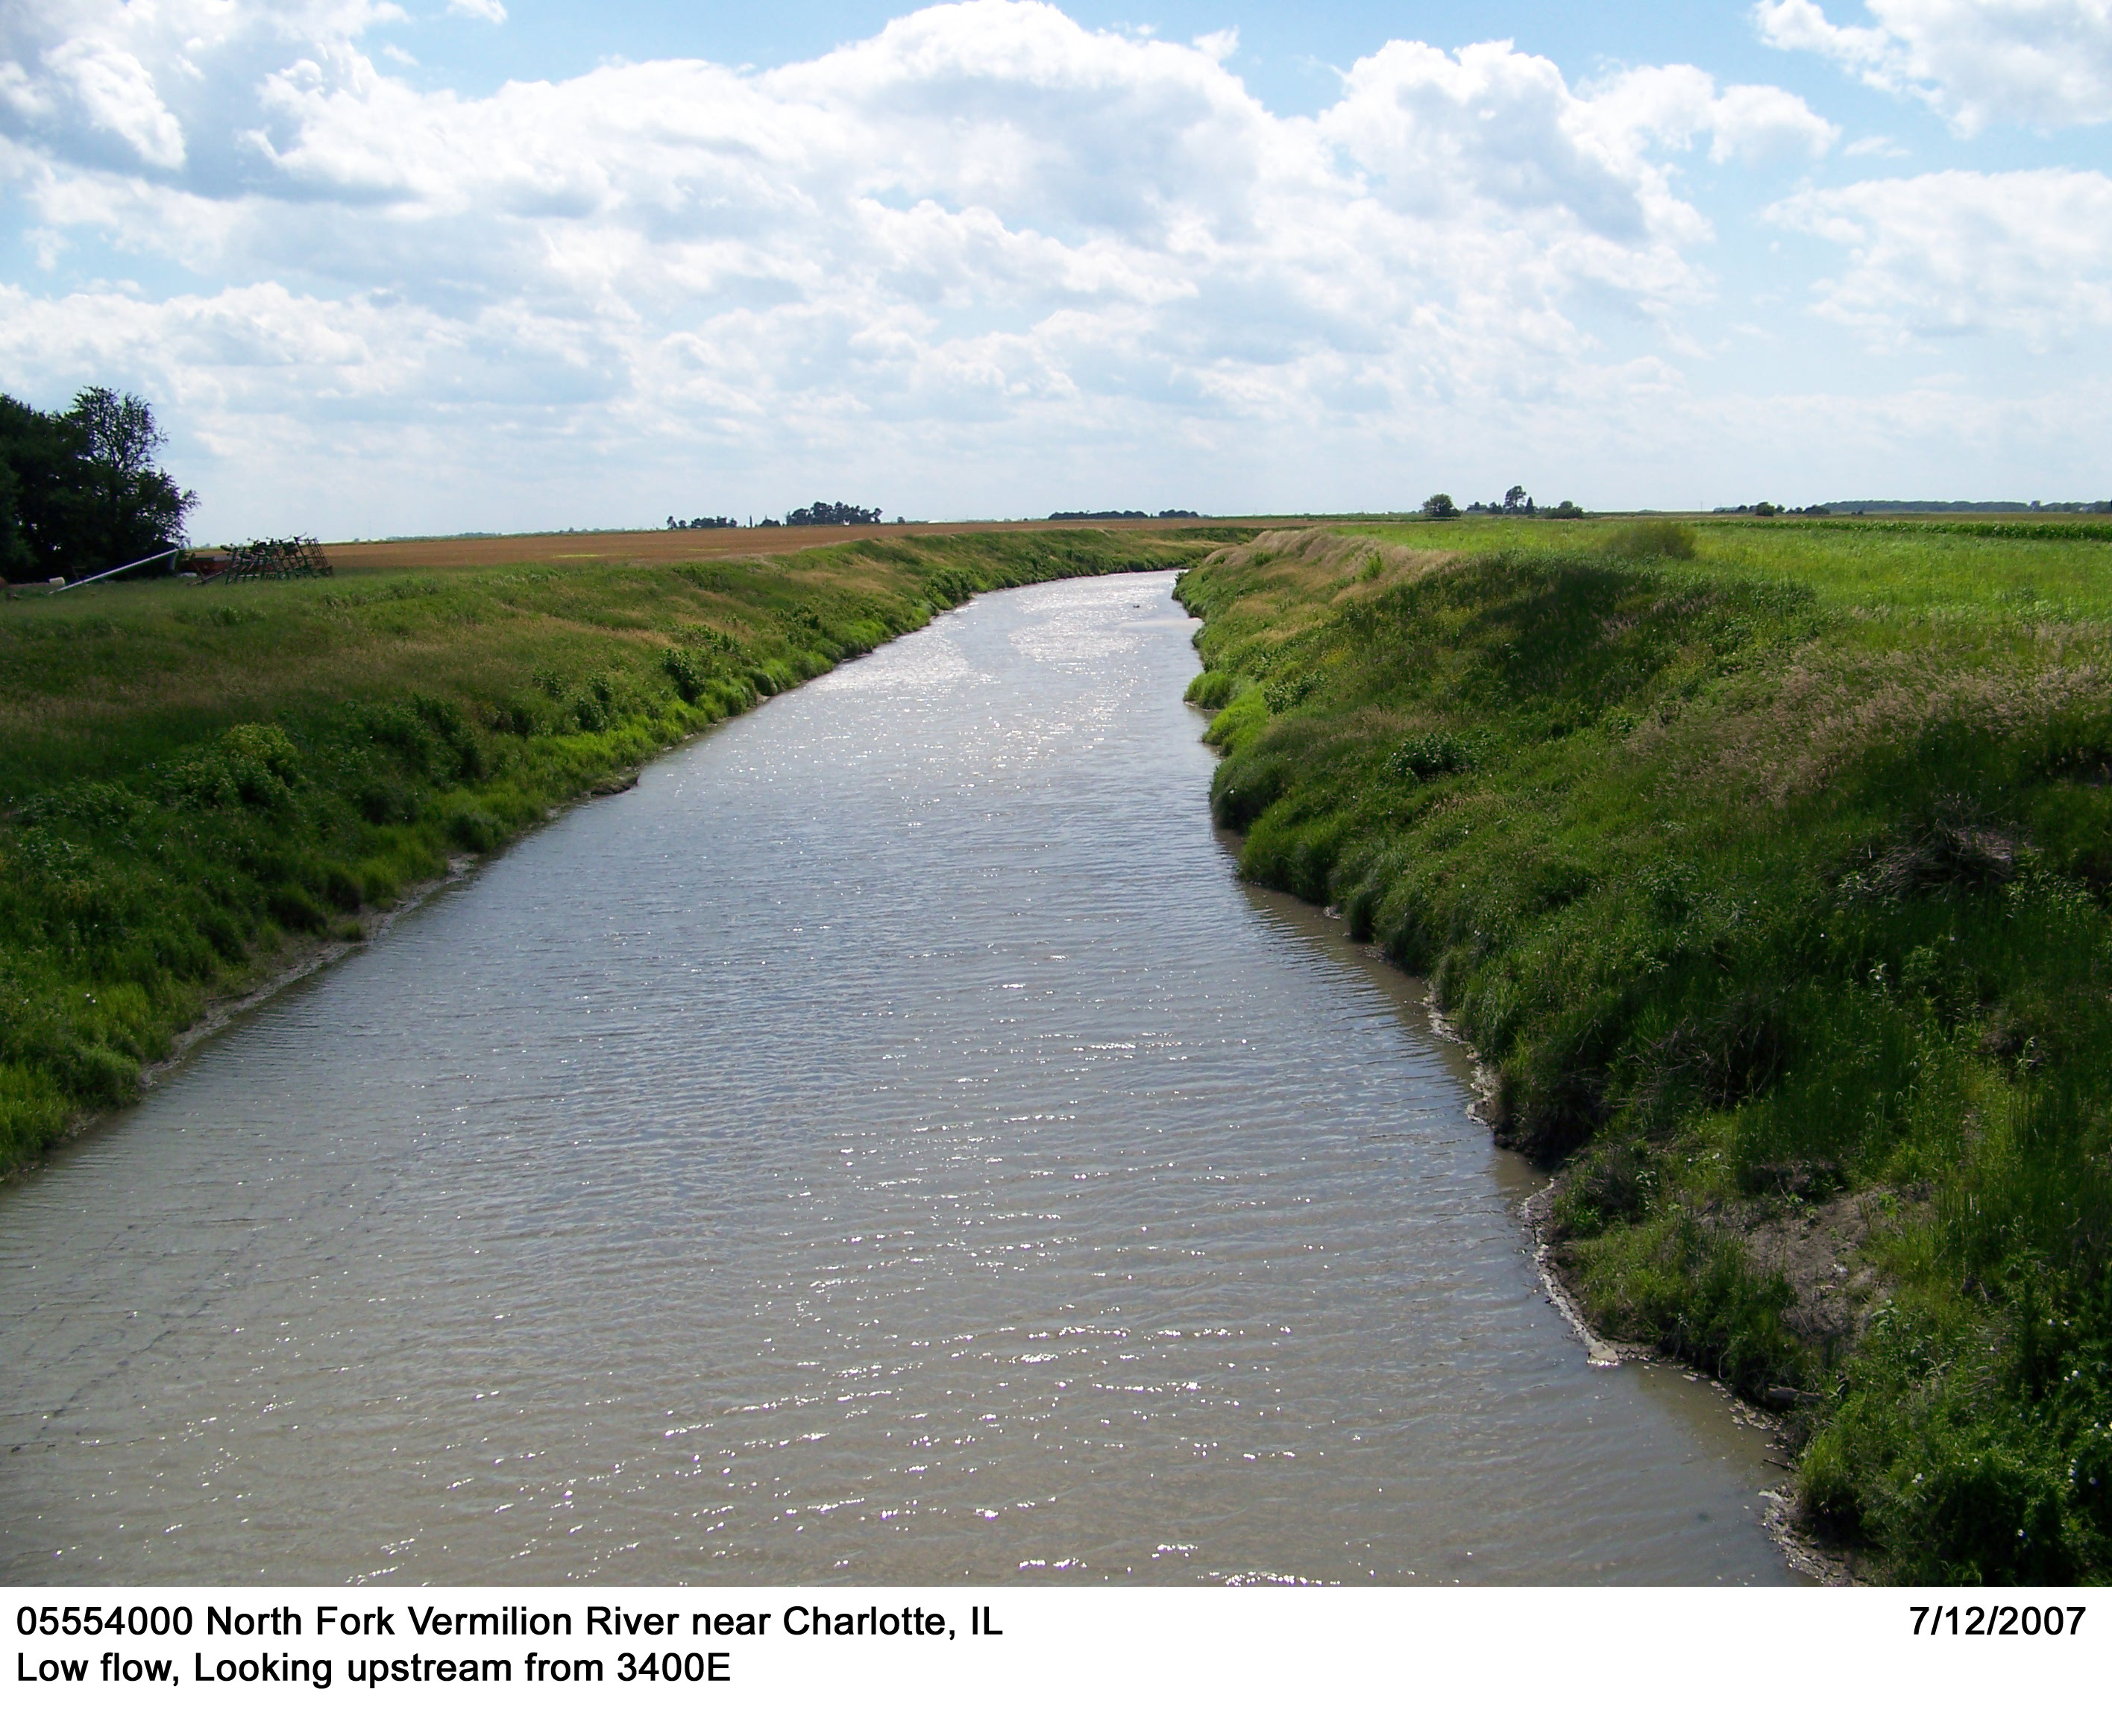
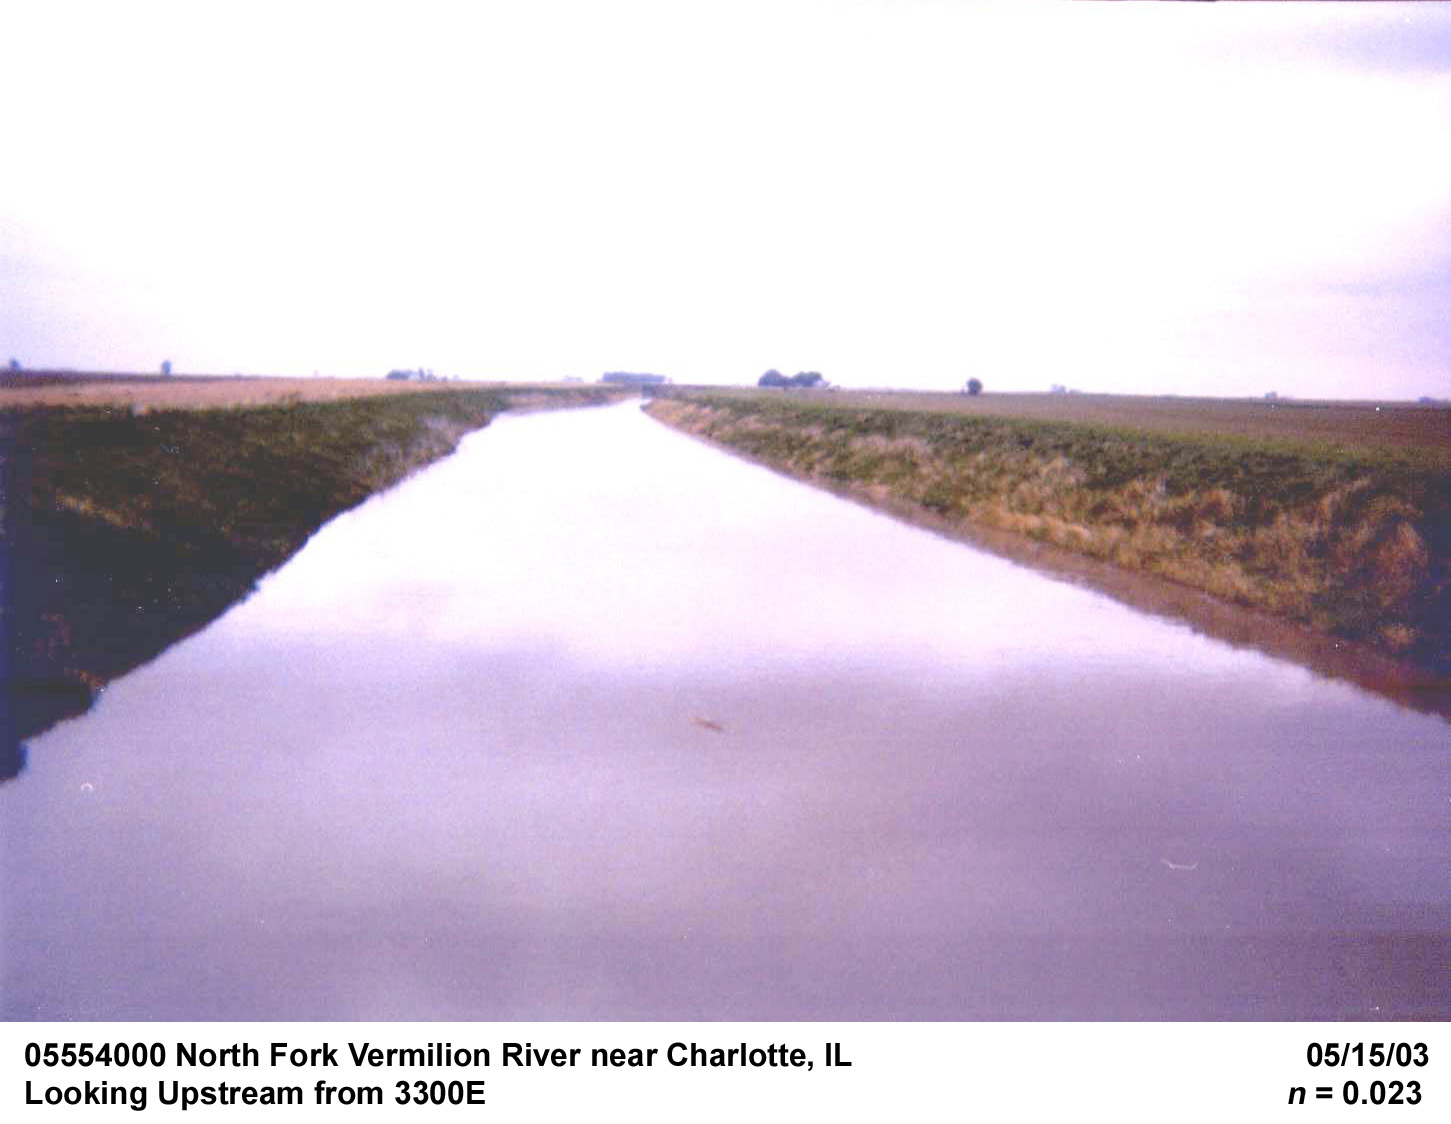
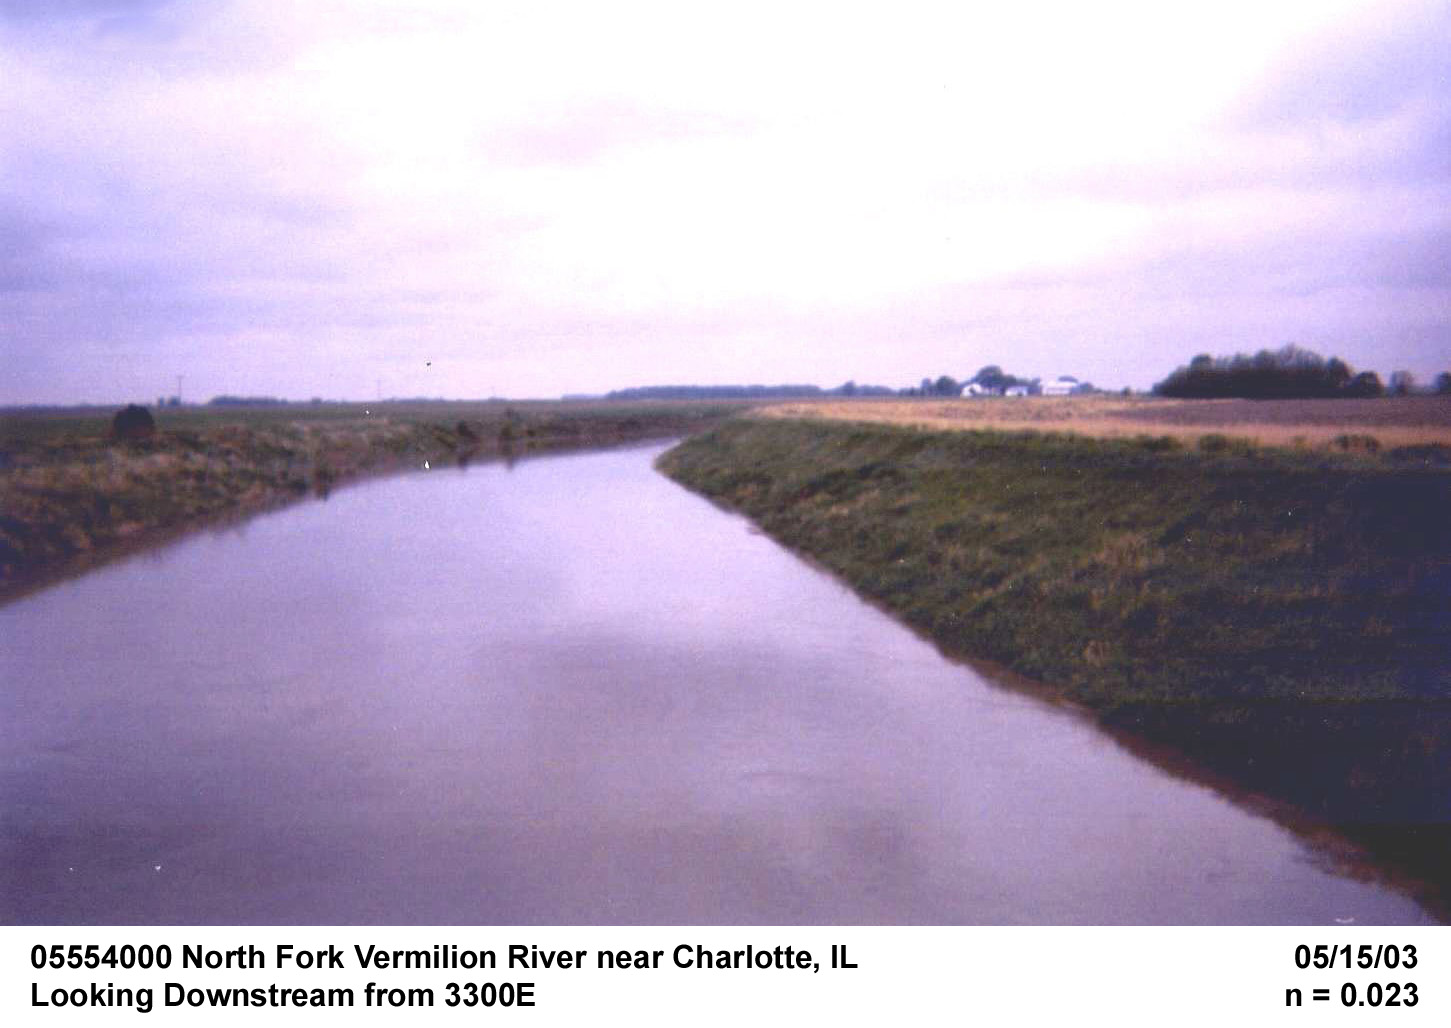
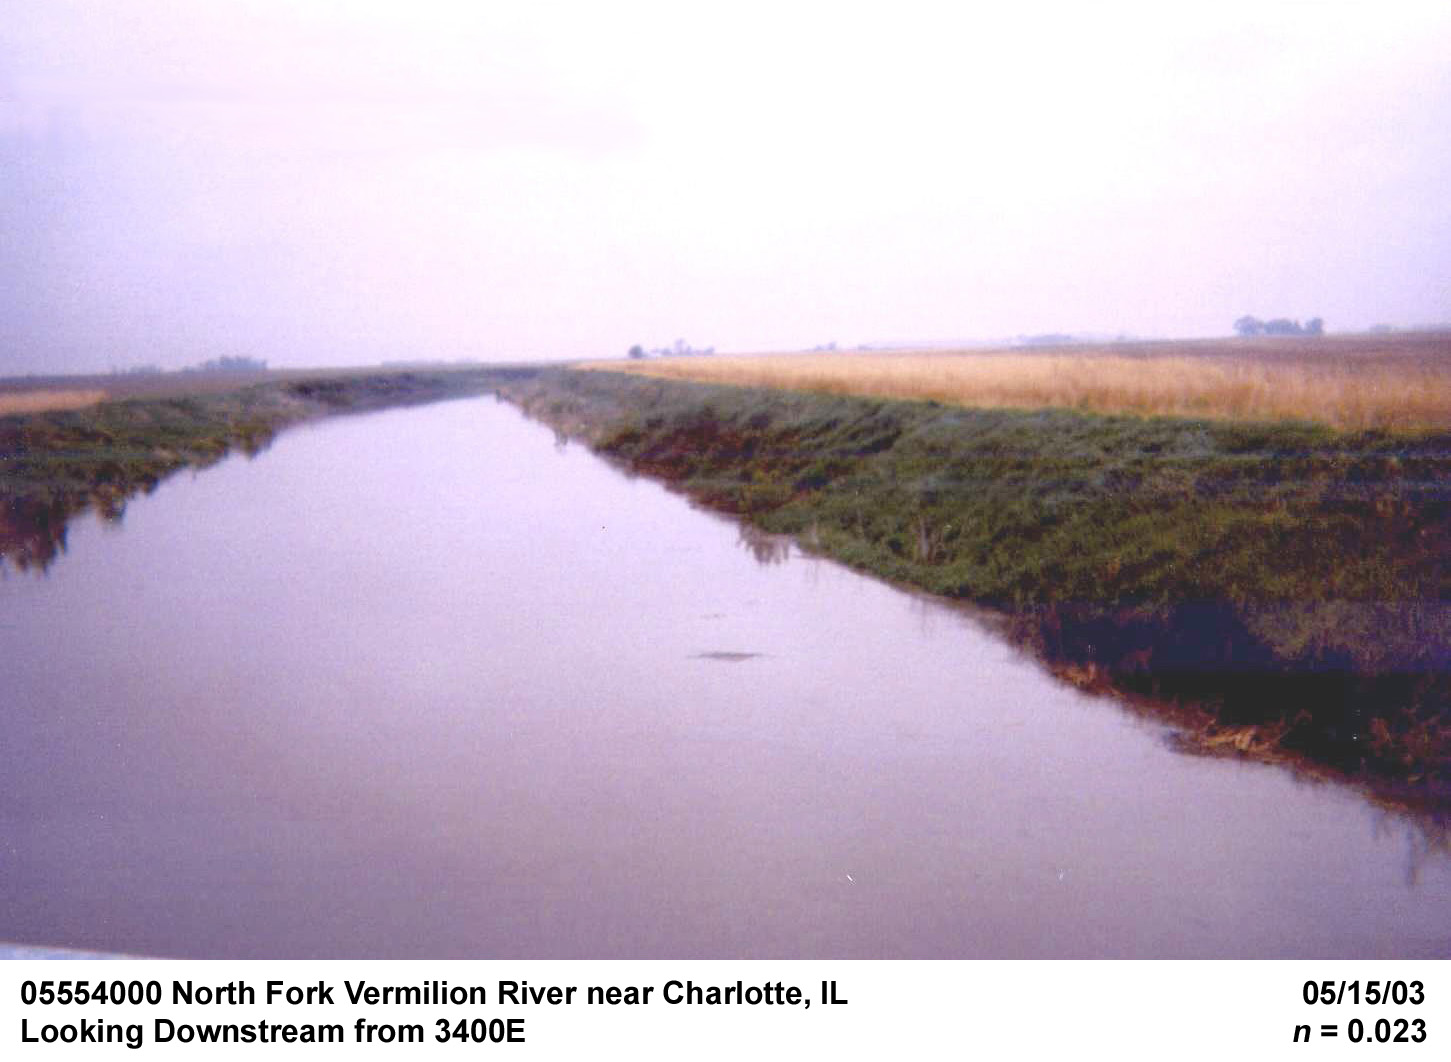
Description of Channel.--This channel is a dredged, well-maintained grass channel. Dredged material has been distributed evenly over the banks. There are no appreciable levees or spoil banks. The bed material consists of soft silt with streaks of gravel. Channel geometries are trapezoidal and are fairly uniform from upstream to downstream. Tall grass and dense weeds spread on both banks. The bottom width of the channel is approximately 70 ft. The banks are about 30 ft in height and have a top width of about 140 ft. Bank slope is steep and the channel is fairly straight.
Floods.--Maximum discharge, 4,900 ft3/s, March 11, 1990, gage height, 16.88 ft; maximum gage height, 17.09 ft, Oct. 3, 1986, discharge, 4,900 ft3/s.

![]() U.S. Department of the Interior |
U.S. Geological Survey
U.S. Department of the Interior |
U.S. Geological Survey
URL: http://il.water.usgs.gov/proj/nvalues/db/sites/05554000.shtml[an error occurred while processing this directive]?
Page Contact Information: David Soong
Page Last Modified: February 4, 2013
