

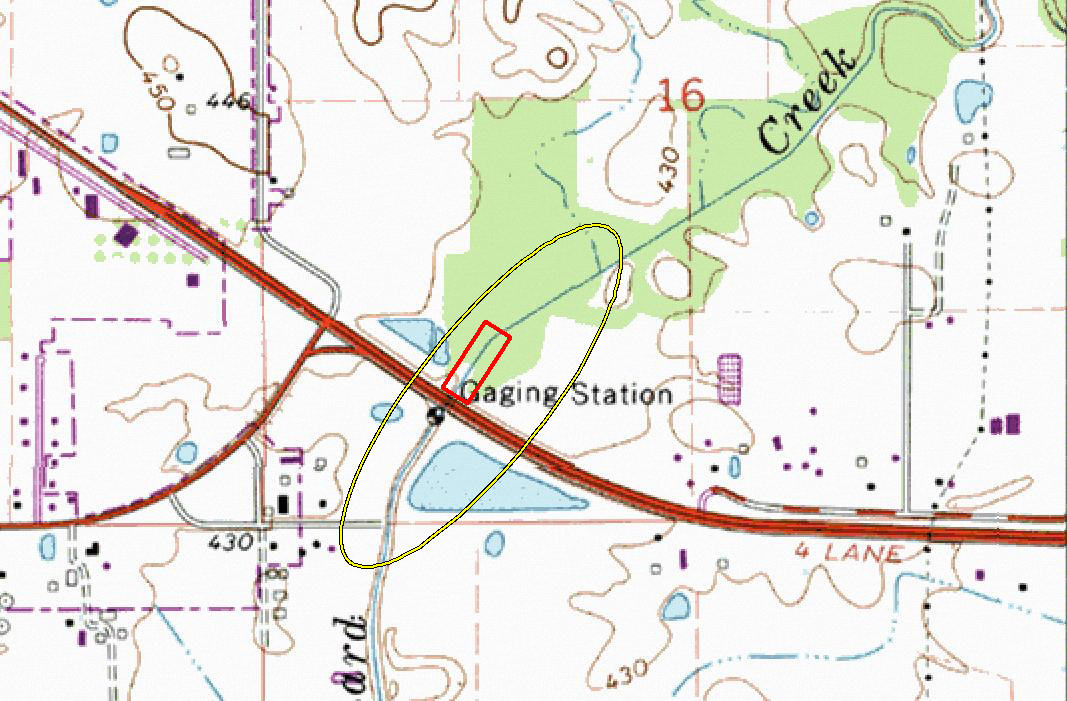
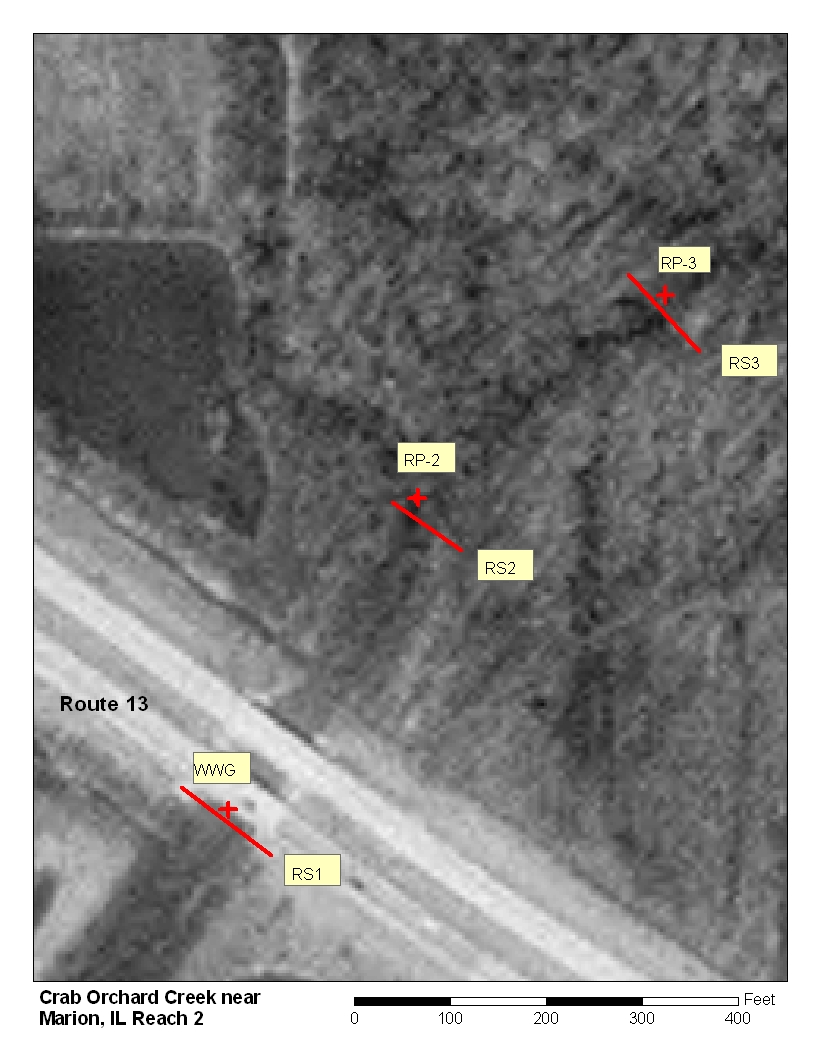
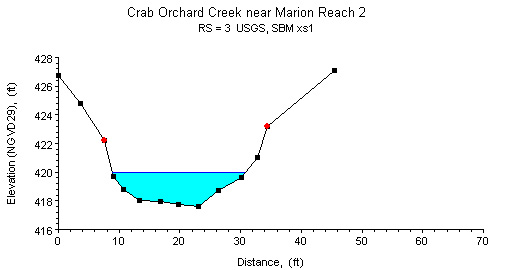
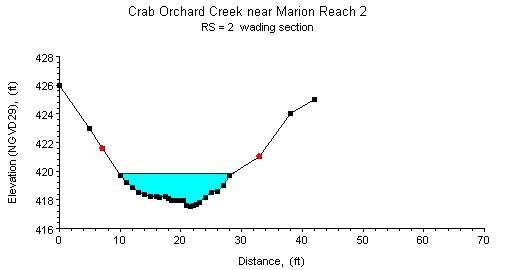
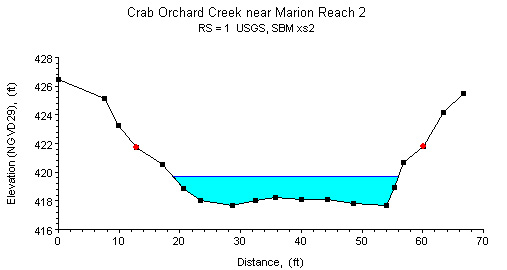
Study Reach.--The channel reach is dredged in an urban setting. The study reach is approximately 600 ft long and extends upstream from the State Route 13 bridge as shown on the quadrangle map on the top left. Three surveyed cross sections (surveyed by the Illinois Department of Natural Resources in June 2005) are available for describing the channel geometries of the study reach (see plots above). The channel alignment, approximate variations in channel width and bank conditions, and locations of cross sections are shown in the aerial photograph on the top right.
Gage Location.--Lat 37°43'52", long 88°53'21", in SW1/4 SW1/4 sec.16, T.9S., R.3E., on the right bank at the downstream side of the bridge on State Route 13, 1.8 miles downstream from Buckley Creek, 2 mi east of the town square in Marion, Williamson County, and at river mile 32.9. The USGS streamgage station number is 05597500.
Drainage Area.--31.7 sq mi.
Gage Datum and Elevations of Reference Points.--Datum of the gage is 415.82 ft. A wire-weight gage (WWG) is located on the downstream side of the State Route 13 bridge. Reference points (RP) for the n-value study are located along the channel on the right bank. RP-2 is a nail in a tree located 795 ft upstream from the WWG, elevation=428.10 ft. RP-1 is a nail in a tree located 443 ft upstream from the WWG, elevation=429.21 ft. All elevations are referenced to NGVD29.
Stage, Discharge Measurements, and Computed n-Values.--Water-surface elevations were measured by tape down from the RP’s and by reading the WWG at the time of the discharge measurements. Discharge was measured using conventional current-meter methods. Flow through a box culvert 500 ft east of the gage on Route 13 starts when the stage in the main channel reaches about 9.3 ft. Because of this lateral diversion, events with a stage higher than 9.0 ft were not used in the n-values study. The computed n-values are listed in the following table. Whenever possible, the computed n-values are associated with a photograph taken at the time of the measurement. The photographs are arranged from low to high discharge in order to illustrate the contributing factors of n-values at a particular discharge.
| Date of Observation | Discharge (ft3/s) | Average Cross Section Area (ft2) | Hydraulic Radius (ft) | Mean Velocity (ft/s) | Slope (ft/ft) | Coefficient of Roughness n |
|---|---|---|---|---|---|---|
| 1/27/1999 | 23.3 | 40.3 | 1.48 | 0.64 | 0.000664 | 0.056 |
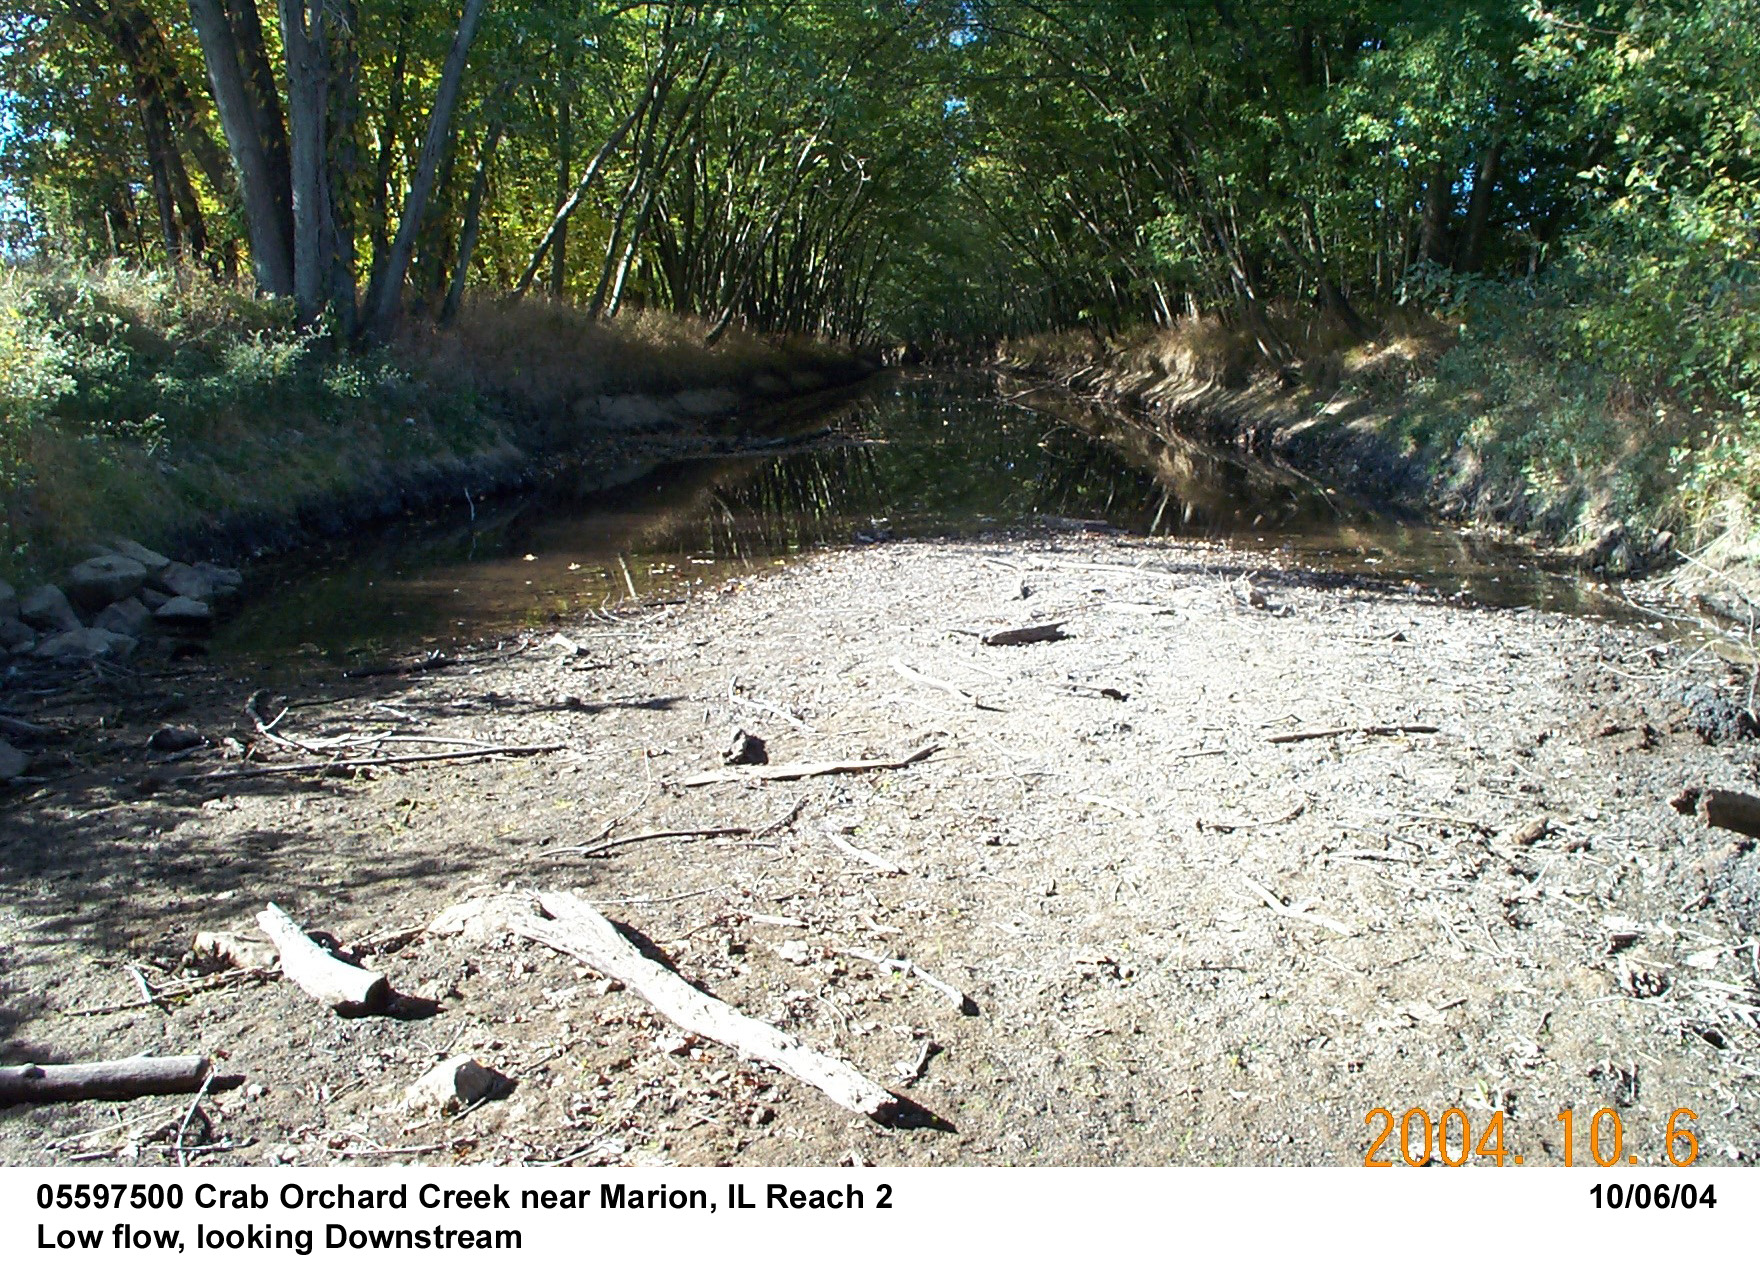
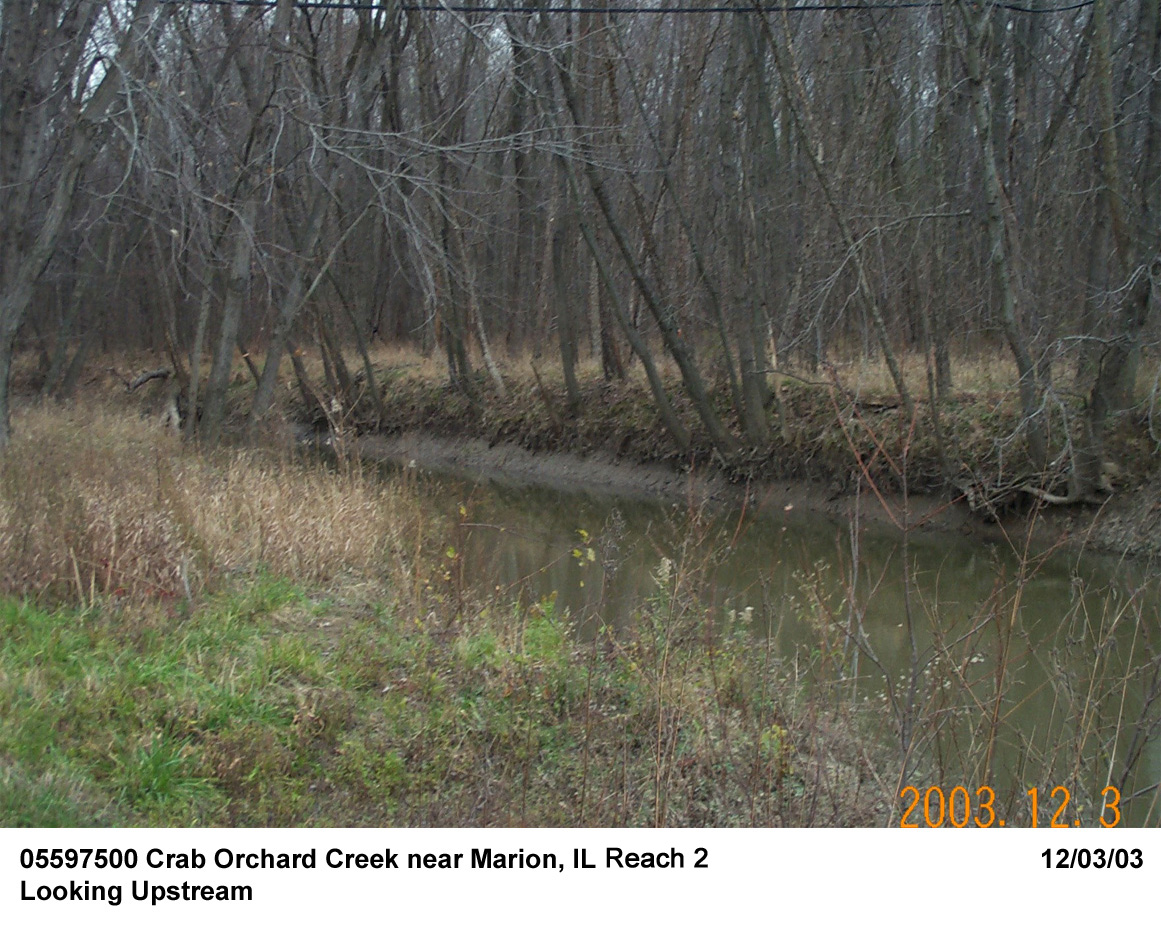
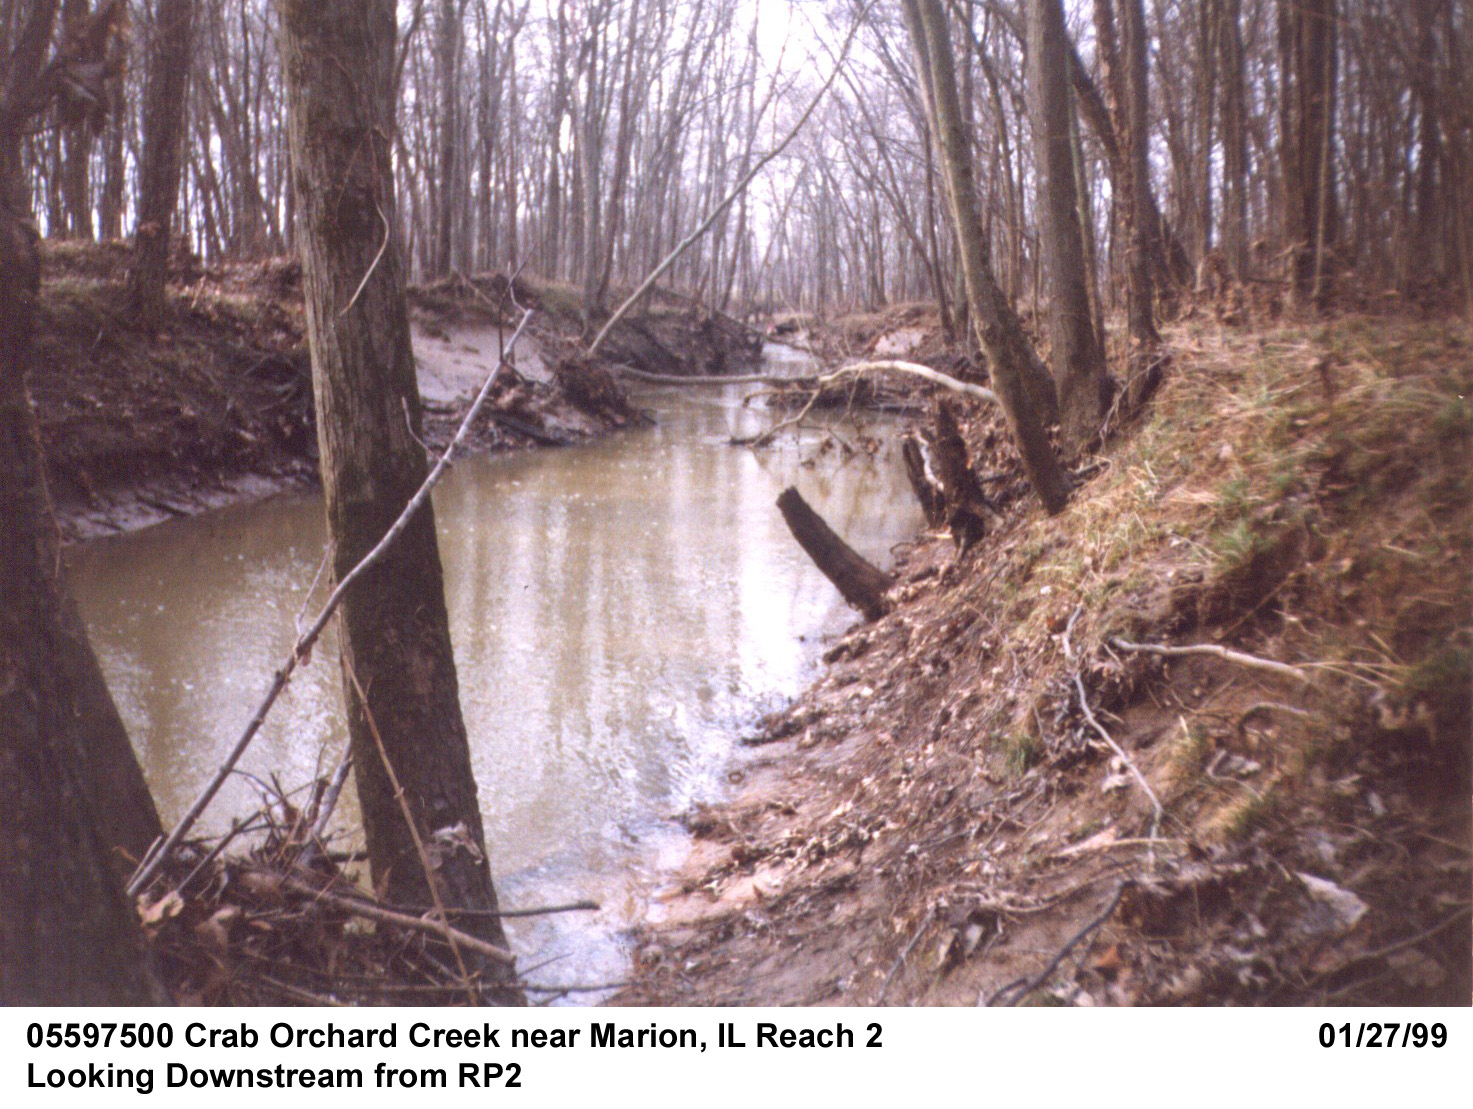
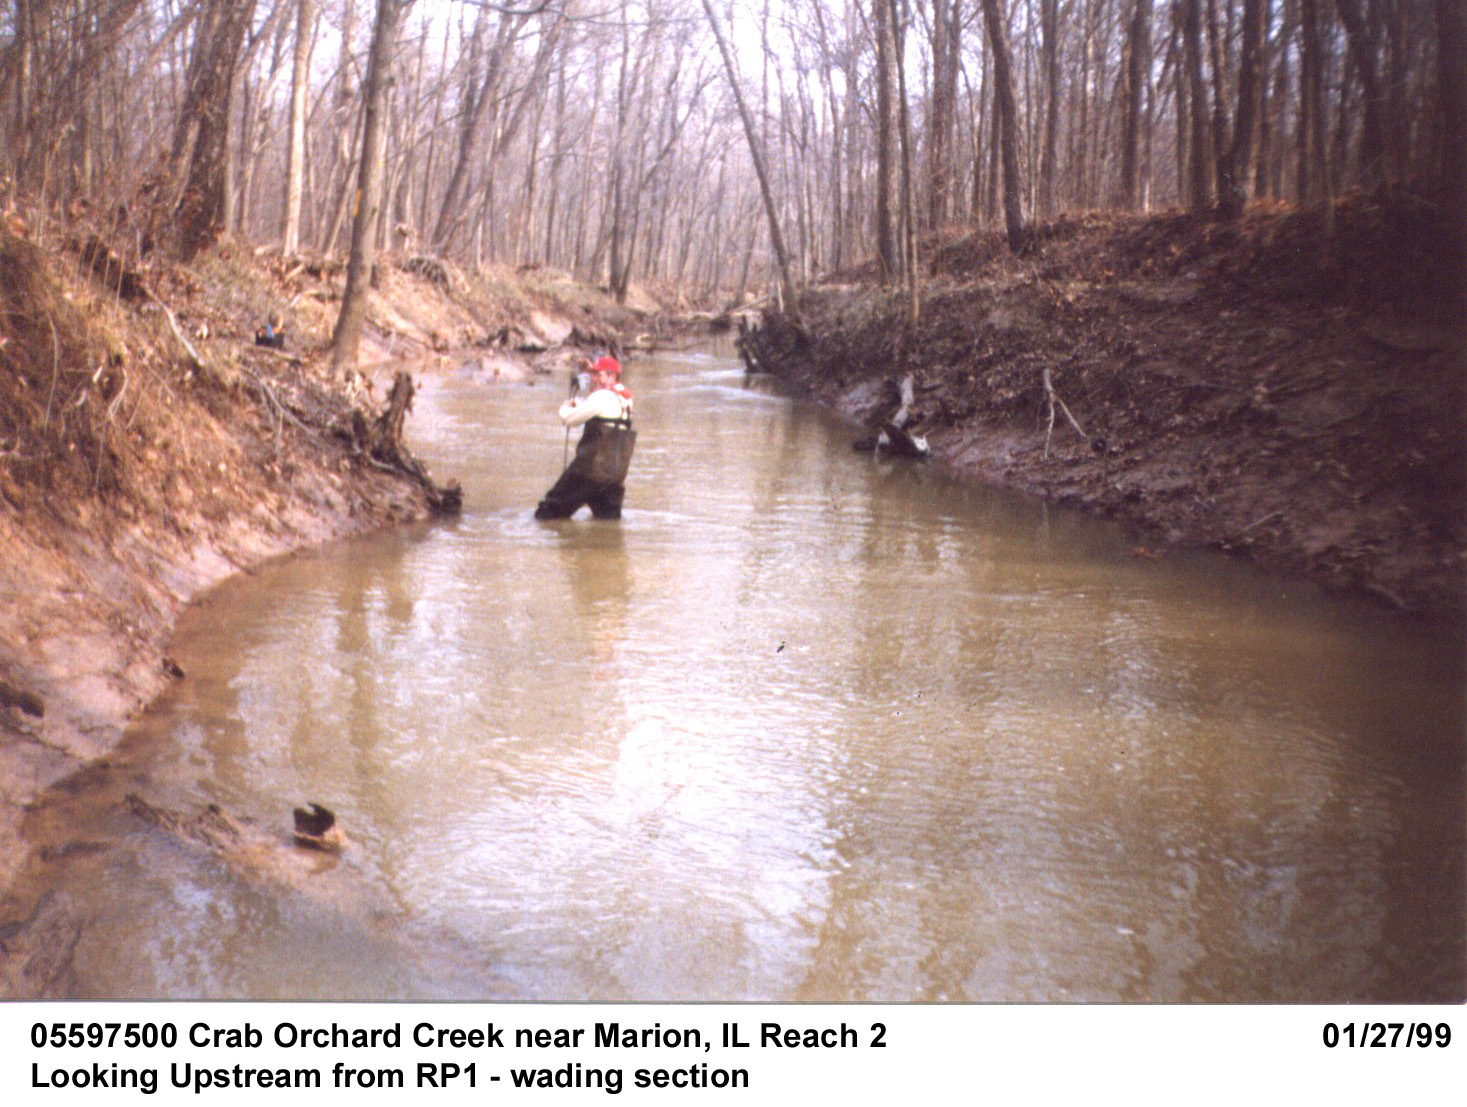
Description of Channel.--This channel has been straightened and dredged. The channel bed consists of clay, sand, and fine gravel mixtures. The bank face is a clay and sand mixture, covered with exposed tree roots and stumps. The top of the banks are covered with trees, brush, and weeds. Both banks are low and will overflow at a stage of about 11 ft. The channel shape can be described as rectangular and channel alignment is straight. The channel is subject to scour and fill. Often, the channel reach is cluttered with log jams, debris jams, and beaver dams.
Floods.-- Mar. 19, 2008, Discharge, 10,000 ft3/2, gage height, 13.74 ft; Dec. 17, 2001, Discharge 9,430 ft3/s, gage height 13.63 ft; May 11, 1996, 9,270 ft3/s (gage height, 13.60 ft), determined by indirect measurement (contracted opening with culvert overflow).

![]() U.S. Department of the Interior |
U.S. Geological Survey
U.S. Department of the Interior |
U.S. Geological Survey
URL: http://il.water.usgs.gov/proj/nvalues/db/sites/05597502.shtml[an error occurred while processing this directive]?
Page Contact Information: David Soong
Page Last Modified: February 4, 2013
